

Do you have an e-shop on Shoptet? Ellity Reports will translate your sales numbers into simple steps that will boost your sales. For each customer, you can see how "fresh" they are, how often they shop with you, and how much they spend. The system translates this into understandable ratings from zero to one hundred and divides customers into groups. You instantly know who to send a welcome series to after the first order, who to gently nudge to make a second purchase, who to give club benefits to, and who to remind when they've paused. The reports are updated daily and easy to download for mass mailings and text messages. Less groping, more orders and healthier margins.
E-tailers are drowning in charts without a point. That's why we've taken just the metrics that drive retention and packaged them into an analytics model with 0-100 scores and Action Step Reports for each chart. The goal is to know in minutes who to put onboarding on the second purchase, who to return, who to add club benefits to - and get it started right away.

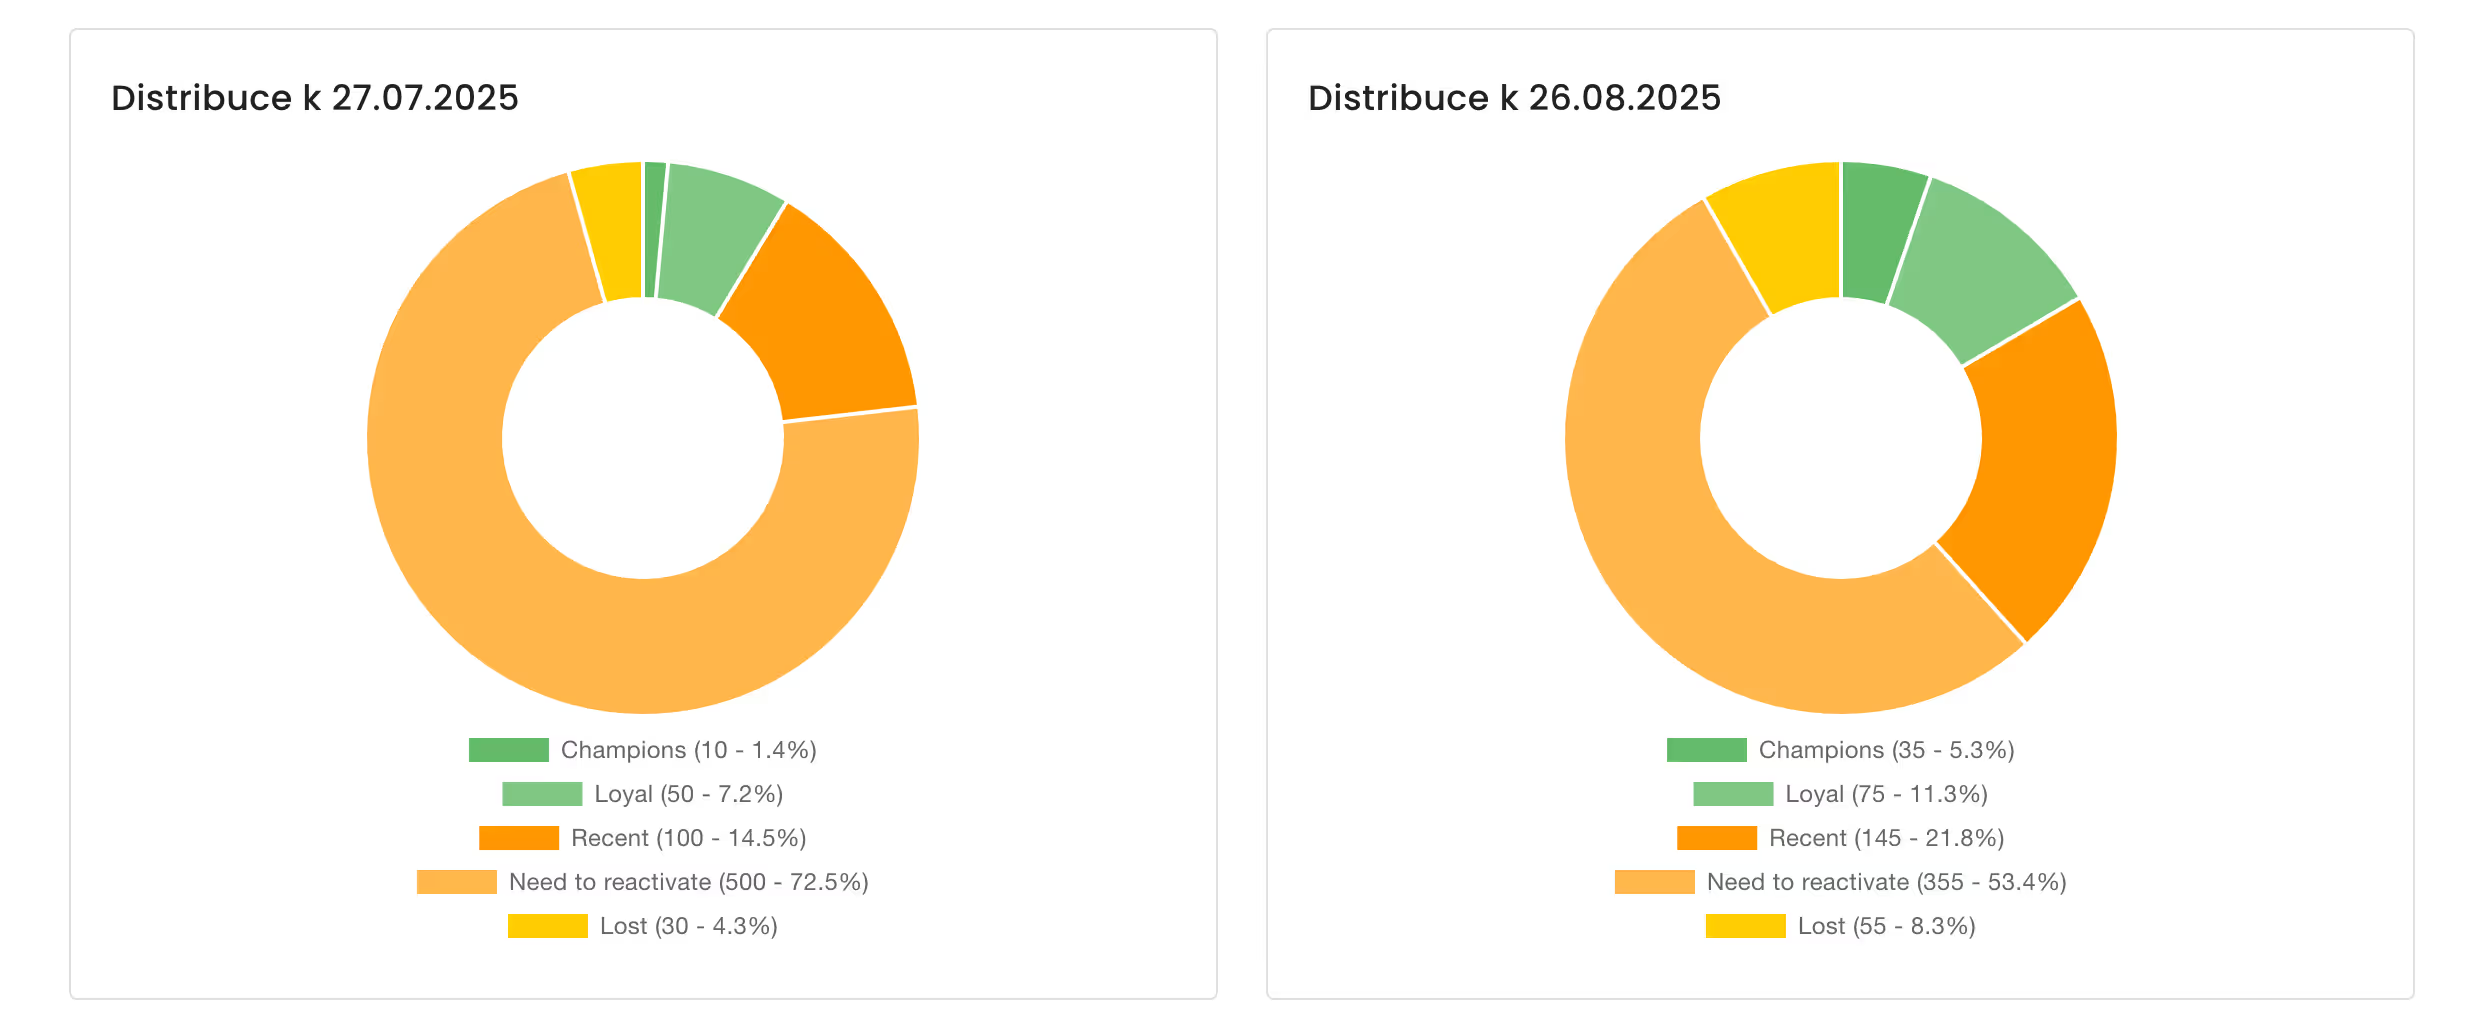
+ Unique customer segments (0-100 score) by behavior (RFM + additional metrics). You can see Champions, Loyal, Recent, Need to reactivate, Lost - and their movement over time.
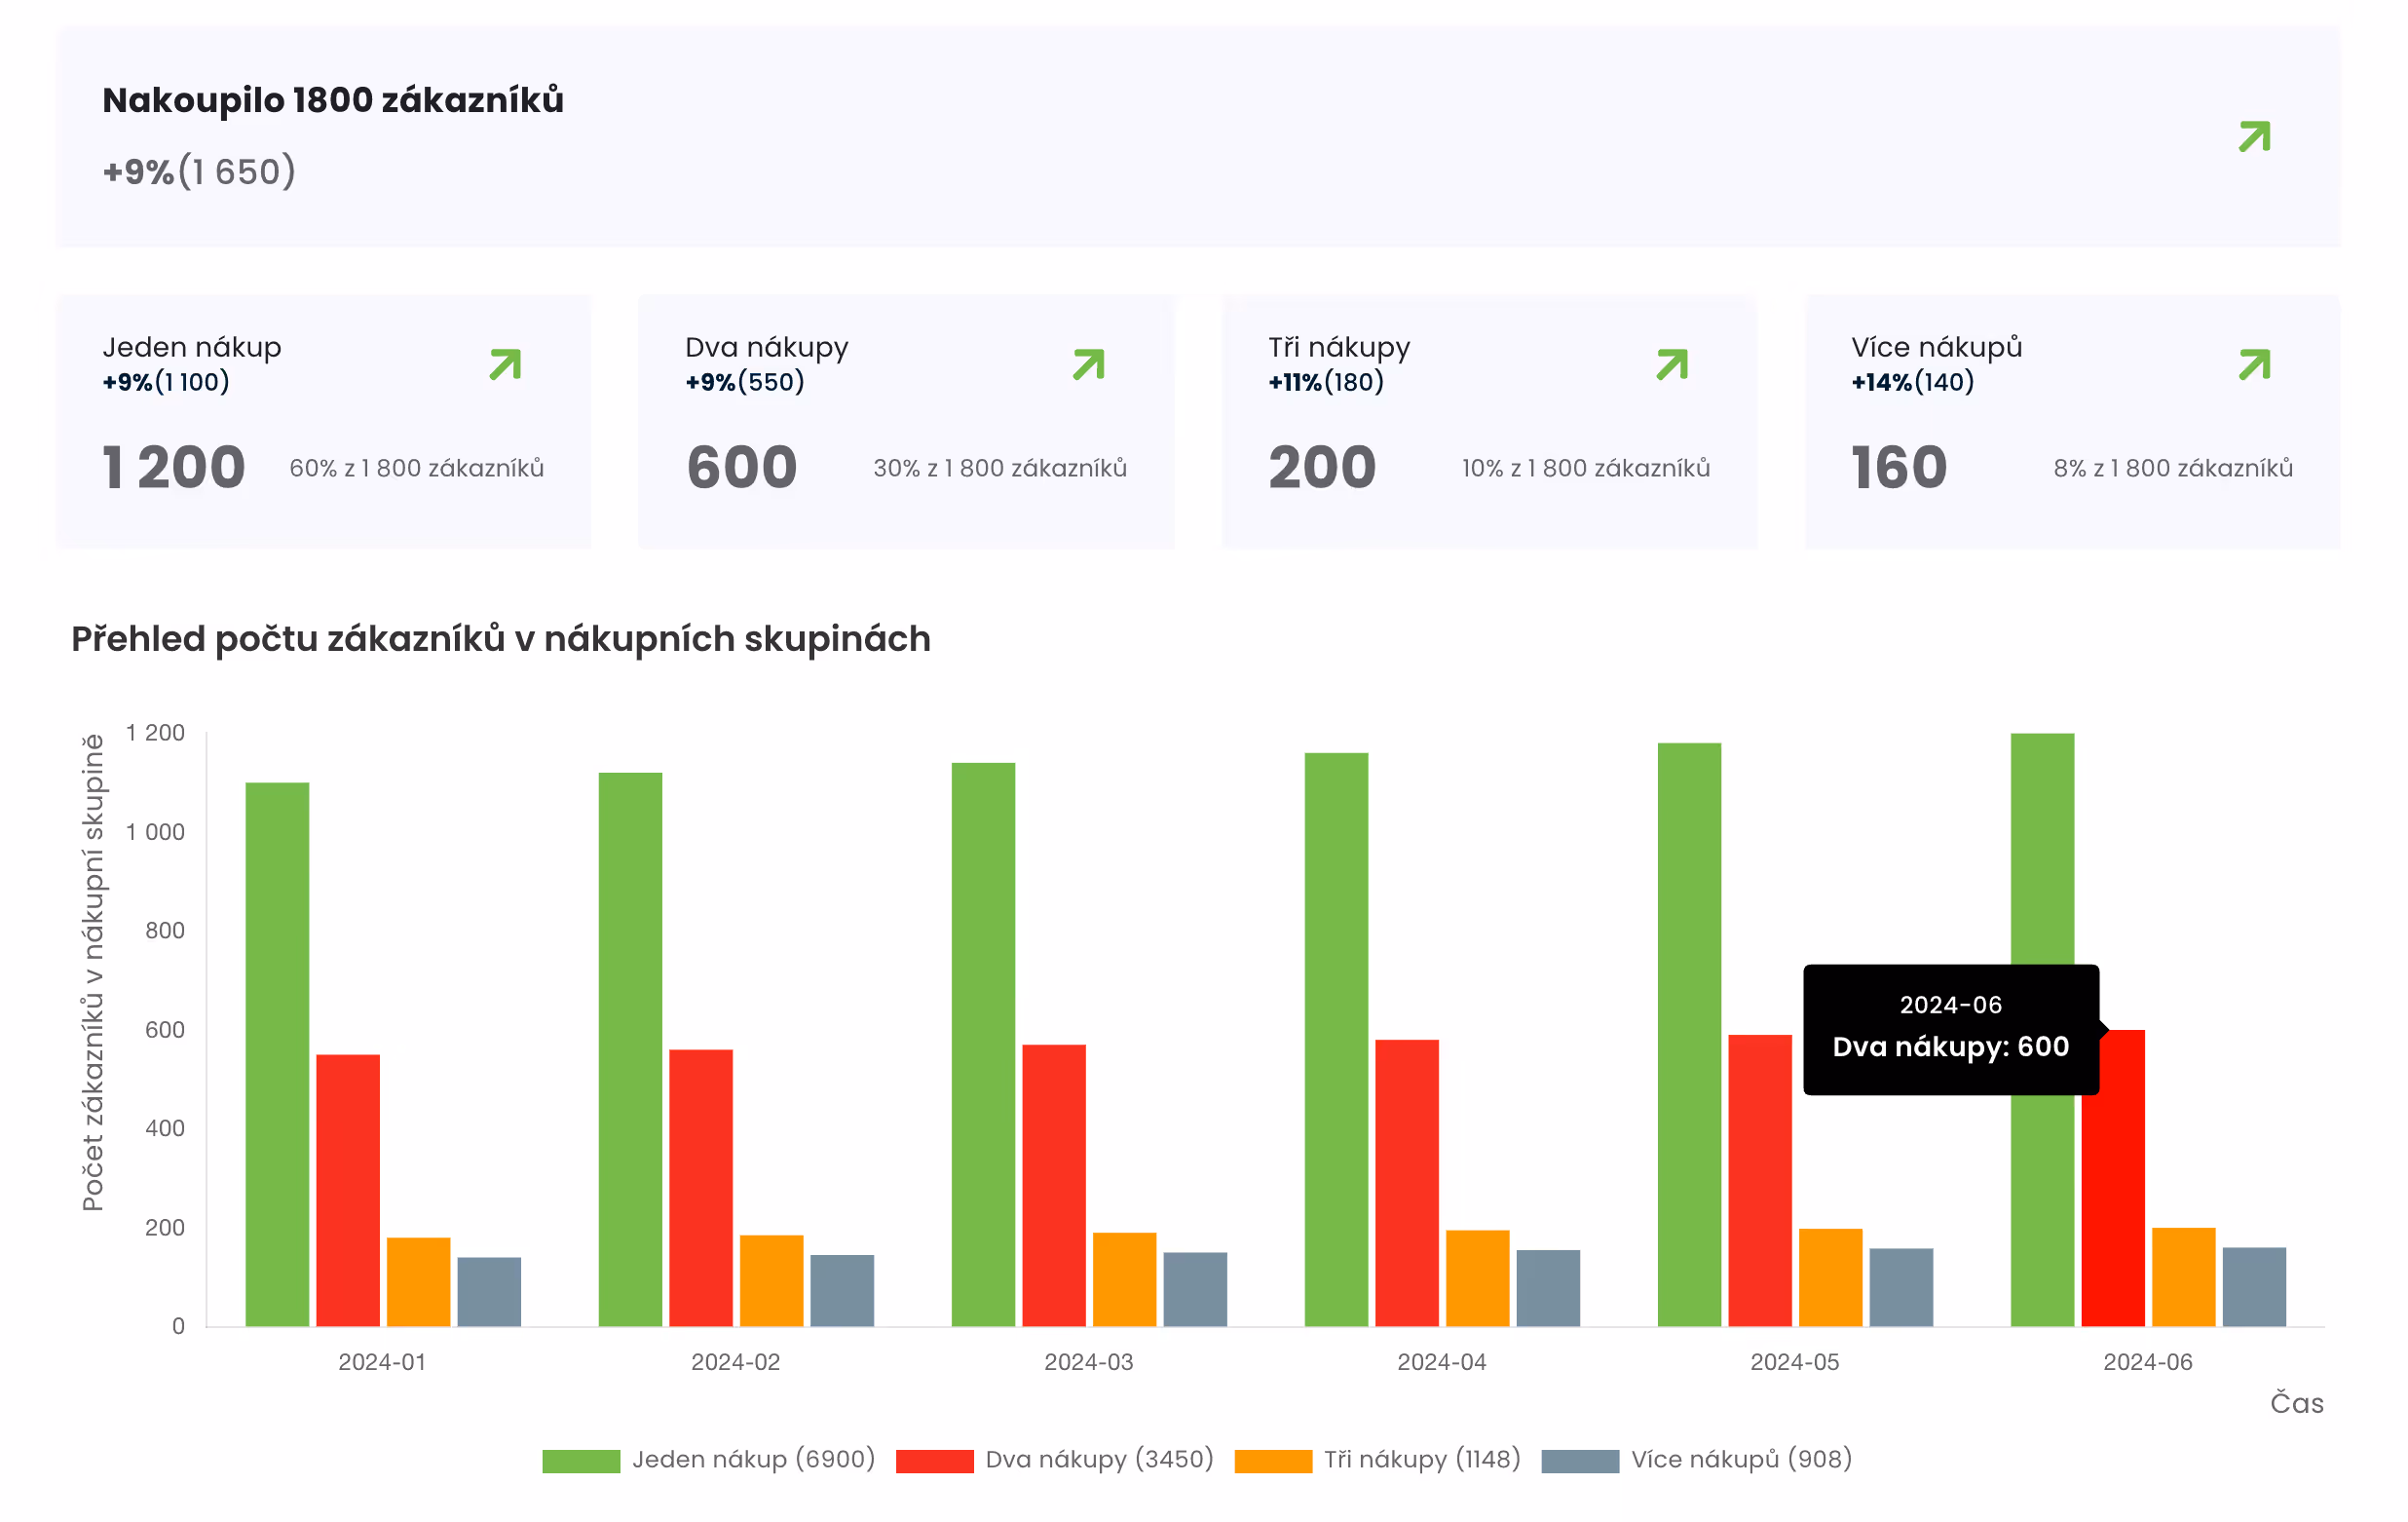
+ Finished reports: points/credits (charged, redeemed, forfeited), purchase cohorts (1st, 2nd, 3rd + purchase), product analysis (drivers, combinations), VIP and Referral performance. Each chart has a clear "what to do from this" and "what to do tomorrow".
+ Daily automatic recalculations and CSV exports with complete dataset for campaigns and BI tools.
Behavioral analytics model: you select metrics (e.g. "when last purchased", "how many times purchased", "how much spent", returns, points usage), set weights and the model calculates a 0-100 score and assigns a segment (Champions, Loyal, Recent, Need to reactivate, Lost).
Daily recalculation automatically: the segmentation is recalculated every night according to fresh data.
Exports for action: for each customer you have a segment, score and input metrics - CSV for precise targeting in email/SMS.
Finished reports:


The feature is part of Ellity for Shoptet. You'll get access to nightly segmentation and detailed exports at the level of each customer - not standard in regular "boxed" loyalty add-ons.
You'll see the shifts between segments (e.g. Recent → Loyal/Champions) and the "drops" to Lost - and you'll immediately get recommended steps for growth and for rescue.
You'll uncover lapsed points and trigger expiration reminders before you lose customer motivation.
You'll find out which products people often buy together, make them into bargain bundles and raise the amount in your basket - without across-the-board discounting.
Customer level export = immediate action in mailings, not weeks of retyping in Excel.
The feature is part of Ellity for Shoptet. You'll get access to nightly segmentation and detailed exports at the level of each customer - not standard in regular "boxed" loyalty add-ons.
+ The investment in complex analytics is 560 CZK per month.
That's about 19 CZK per day. At a margin of 200 Kč per order, it takes 3 extra orders per month to pay for the feature; at a margin of 150 Kč, it's 4. Anything above that is net profit.
1. In Ellity, open Settings → Ellity Business Intelligence.
2. Create a model: name, select a period, set metrics and weights, save.
In Reports, view segments and transitions, download the CSV and run onboarding, win-back or VIP action.
You'll see simple graphs: how points are charged and redeemed (and how many are forfeited), customer groupings and their transitions over time, numbers of 1st, 2nd, 3rd+ purchases, top selling products and combinations that are often bought together, plus referral performance (how many visits and orders referrals brought) and VIP levels. There are "what's next" and "action steps" for each chart so you know exactly what to do.
You don't have to program. In a few steps, you select a period (e.g. 90-180 days), choose metrics (when last purchased, how many times, how much spent, etc.) and give them weights. The system calculates a 0-100 score and places each customer into understandable groups (e.g. Champions, Loyal, Lost).
No. Segmentation is recalculated automatically once a day at night. In addition to the detailed reports, you can generate period comparison outputs at any time and download them as an Excel file (CSV).
Yes. Each report has a Detailed Report (CSV). For each customer, there is a group, their score, and input metric values - perfect for targeting mailings.
According to the reports, you can immediately: remind about the upcoming expiration of points, give days 2× points in weaker days, create bundles from products that are often bought together, send onboarding on the second purchase and reward top referrers. All this with clear recommendations by the charts.
Yes. You choose the time window based on how fast you typically shop (shorter for fast categories, longer for slow categories). The recommendation is directly stated in the help.
You add the metrics of return rate and point usage (with less weight) to the model. This will help separate quality purchases from problematic ones and reward sensitivity.

Excellent add-on, easy to set up and use, both for us as an e-shop and for our customers. They got used to it very quickly and we see an increase in orders after the first months of use. I also very much appreciate the great working helpdesk.
The loyalty system has significantly helped Rudolf Jelinek's e-shop to increase customer loyalty. We increased conversion rates by 26% and saw a significant reduction in customer acquisition costs. We are very happy with the results! We can recommend this loyalty system.
A great add-on that has a number of nifty settings. We can even divide customer groups and set a limit for the minimum order amount to redeem points. Our customers have embraced the ability to collect bonus points with enthusiasm. We highly recommend this add-on.
But what I have to highlight is the great customer support, they helped us personally set everything up, advised us on everything we needed to know and even customized the add-on to our icon colors. They were quick to communicate and respond to our suggestions. This is simply what customer support should look like

