


What is an analytical model and what is it used for
An analytics model is a set of rules that evaluate customer behavior using selected metrics. Each customer receives a score (0-100) and is assigned to a segment (e.g. Champions, Loyal, Lost).
With the model, you'll quickly know who's most valuable to you, who's on their way out, and who's worth sending a reactivation or loyalty offer to.
Typical uses: campaign targeting, reward management, care prioritization, reactivation and retention monitoring.
How to create the first model (step by step)
1) Open Ellity BI settings
Go to Settings → Ellity BI.
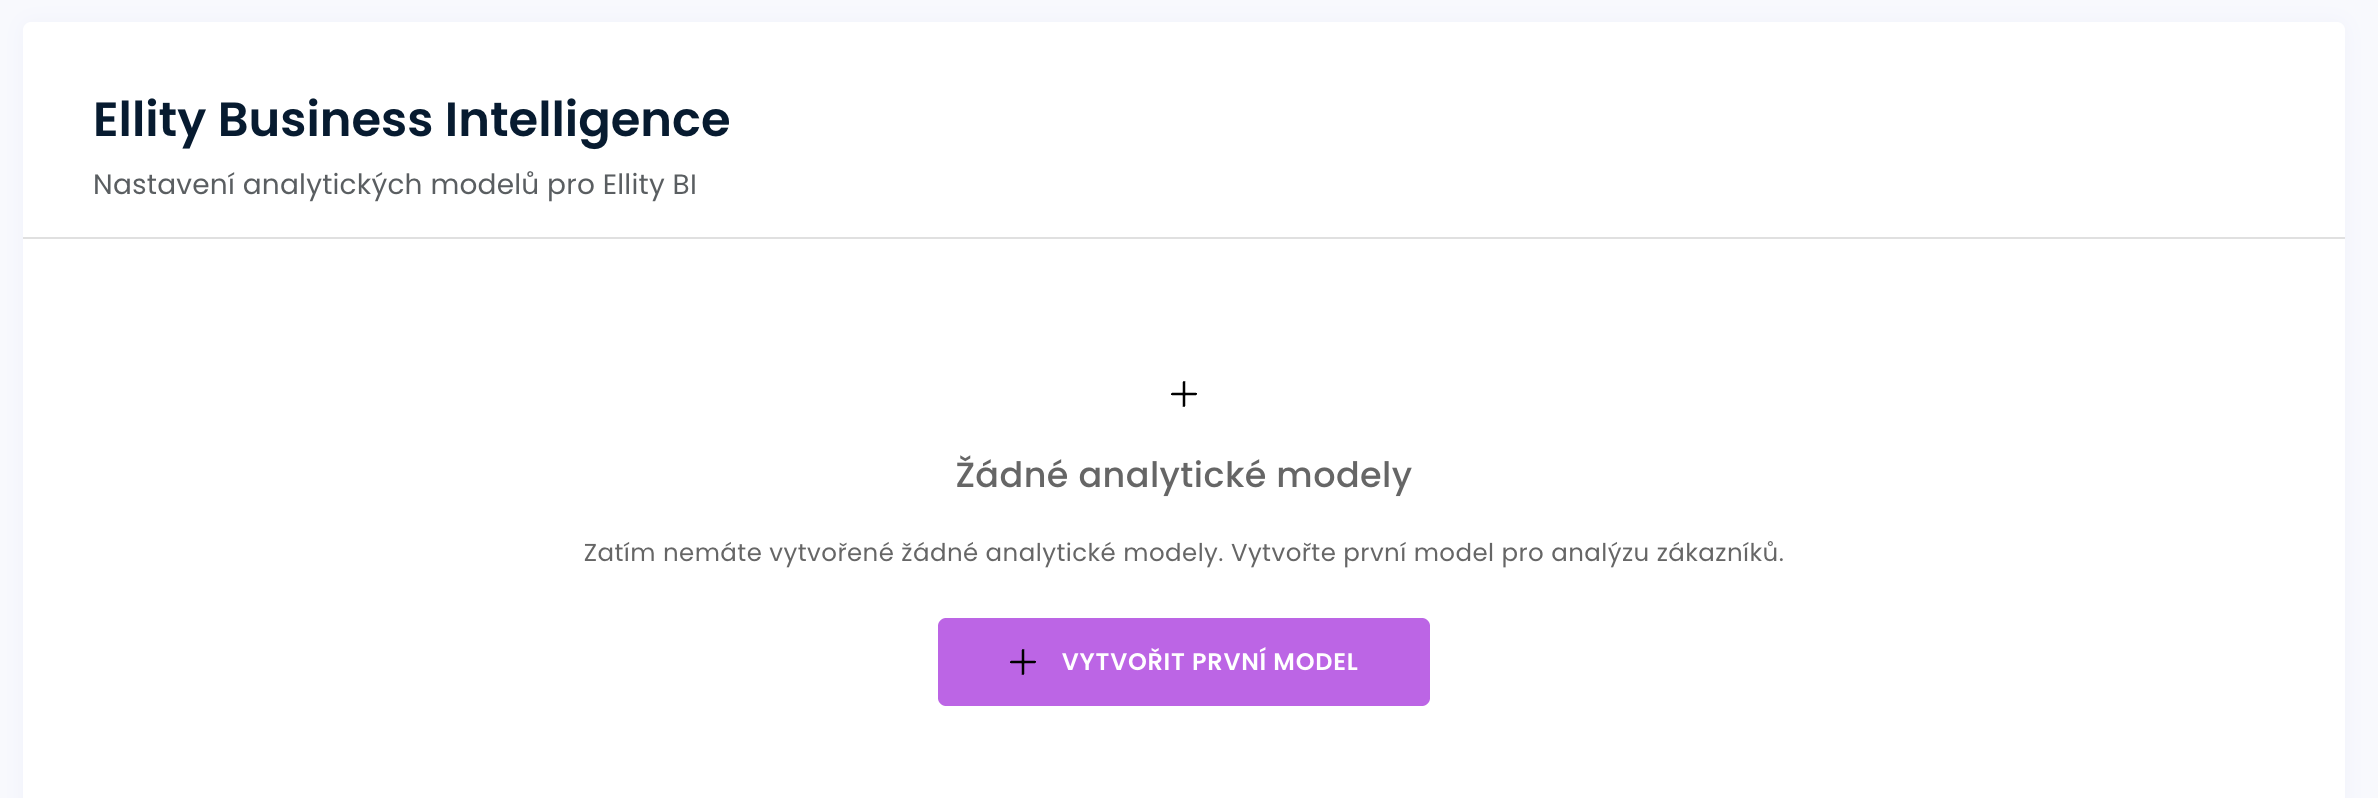
If you don't have a model yet, you will see a blank screen with a Create First Model button (see the "Create First Analytical Model" figure).
2) Basic model data
Enter:
- Name and description - to help you recognize the purpose of the model (e.g. "RFM - e-shop 180 days").
- Time window - the period from which the metrics are calculated (e.g. 90-180 days depending on the length of your buying cycle).
Recommendation: choose such a long period that most active customers can make at least 2 purchases.
3) Select metrics and set weights
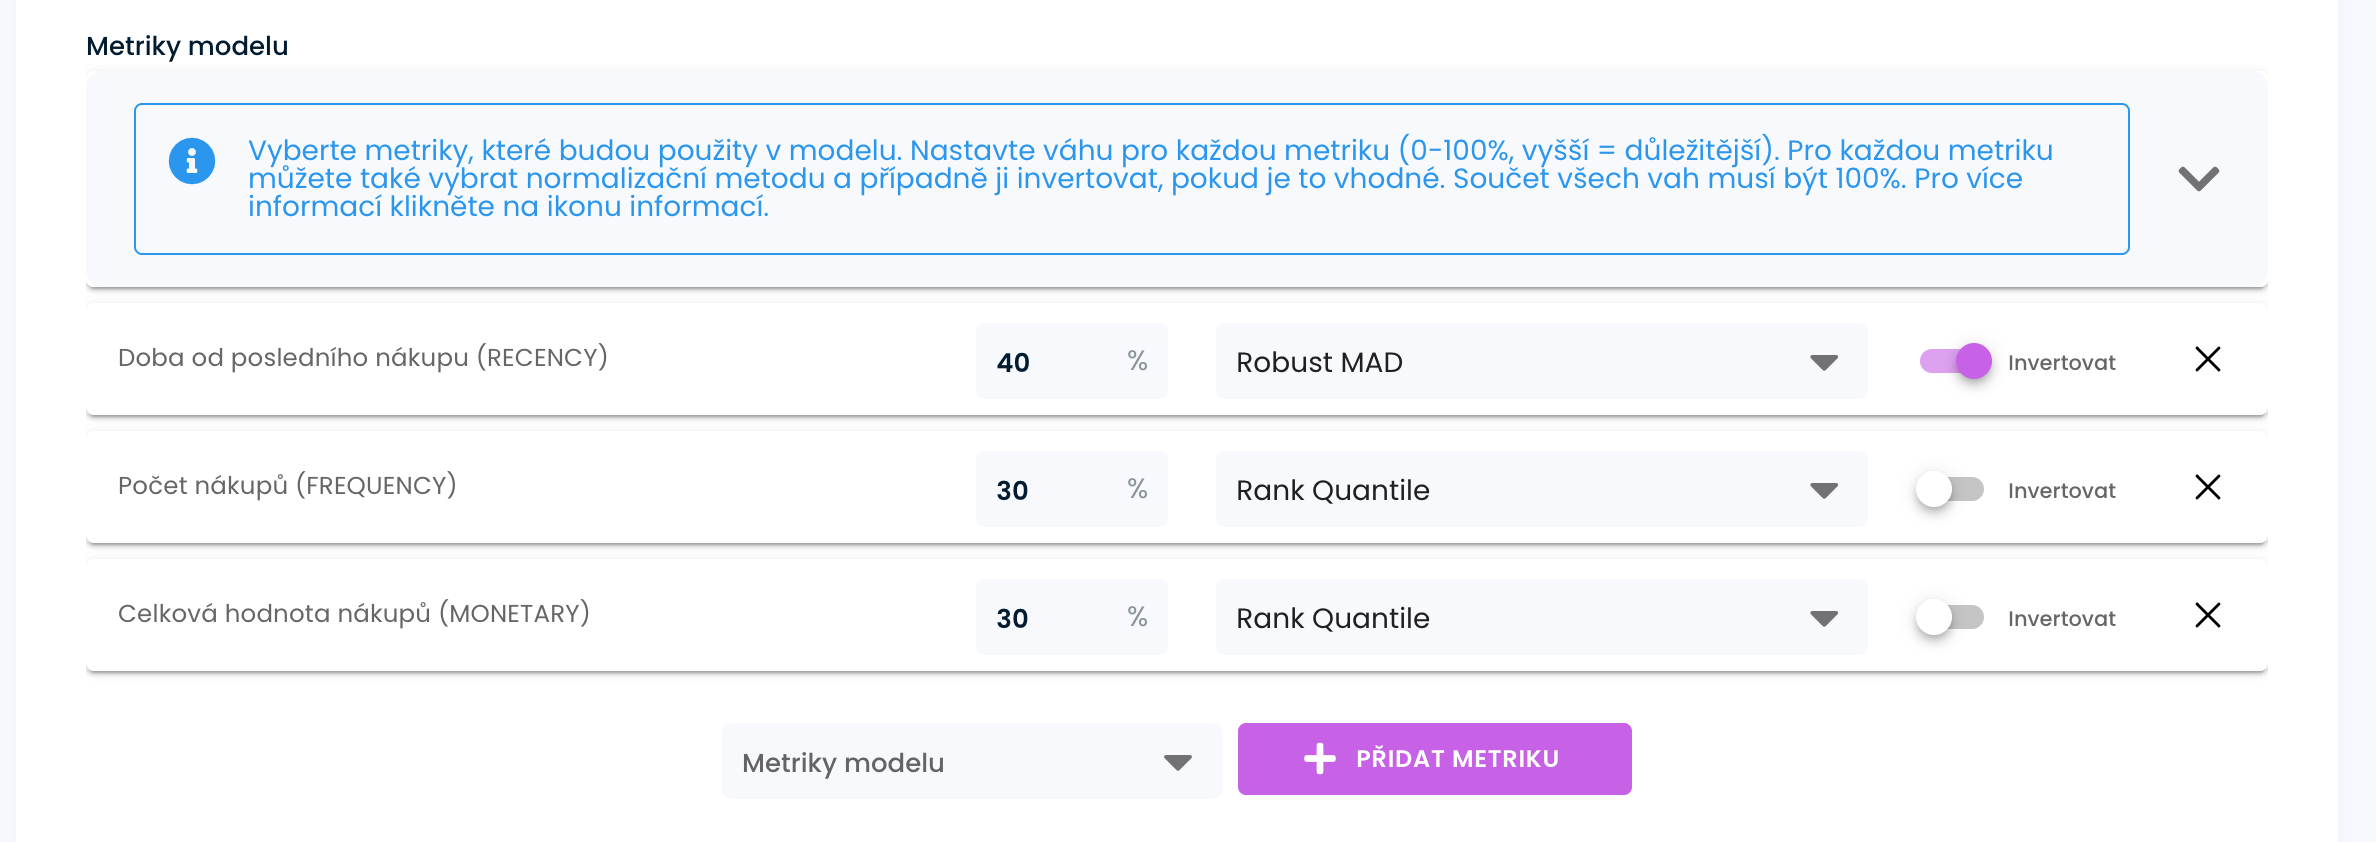
In the Model Metrics section, select the metrics and set their weights (0-100%, higher = more important).
The sum of all weights must be 100% (see the "Model Metrics" figure).
You can also select a normalization method for each metric and invert it if appropriate.
Standardisation methods
Min-Max
Simple 0-100 scale between lowest and highest value. The most readable option. Suitable for ratios and where you want 'quick and clear' results. Beware of extremes - they can stretch the scale.
Z-Score CDF
'Probability' relative to the mean (0-100). Compared to the mean and variance, it gives a sense of probability (but it is not a true probability, it would have to be calibrated to history). Great for estimating exit risk. Less tolerant of extreme values.
Robust MAD
Stable even at extremes (median + MAD). Stable method that does not get upset by extremes. It is useful where there are long pauses between purchases or a few exceptionally expensive orders. Ideal for: recency (time since last purchase), intervals between purchases (IPT) and average order value (AOV).
Rank Quantile
Percentile - ranking among all customers. It does not deal with absolute values, just ranking. Ideal for 'TOP X %' and fair comparison (e.g. monetary, frequency). The result is always nicely spread out.
Default methods for metrics
Time since last purchase (RECENCY)
Robust MAD: Most buy 'recently', a few are quiet for a long time → a robust method is needed.
Recommended by: robust_mad. Alternative: zscore_cdf if you want to read the output as a 'probability' of risk.
Average time between purchases (IPT)
Robust MAD: Regular purchases vs. a few extremely long breaks → robust wins.
Recommended by: robust_mad. Alternative: zscore_cdf for 'probability of next purchase'.
Total value of purchases (MONETARY)
Rank Quantile: Few VIPs spend significantly more → percentiles rank fairly.
Recommended: rank_quantile. Alternative: minmax, if you want a linear, easy-to-read score.
Number of purchases (FREQUENCY)
Rank Quantile: Most shop occasionally, a few very often → percentiles are fair.
Recommended: rank_quantile.
Average Order Value (AOV)
Robust MAD: Large orders can distort the average → robust method can handle it.
Recommended by: robust_mad. Alternative: rank_quantile for simple ranking.
Percentage of returned orders (RETURN_RATE)
Min-Max: It's already 0-1 → simply convert to 0-100.
Recommended: minmax. Alternative: rank_quantile for relative ranking between customers.
Percentage of purchases on which points were used (ENGAGEMENT_POINTS)
Min-Max: Share in 0-1 → simple and readable.
Recommended: minmax. Alternative: rank_quantile for cross-base comparison.
The time the customer buys (LIFESPAN)
Robust MAD: Most are short, a few are very long → robust better accentuate deviations.
Recommended by: robust_mad.
What is inverting?
Inverting changes the scale direction of the metric. When a metric is inverted, lower values get higher scores and vice versa. This is useful for metrics where 'better' means a lower value (e.g. recency - time since last purchase).
Default inverted metrics:
Recency - time since last purchase (higher value = worse customer)
Interpurchase time - spacing between purchases (larger value = worse customer)
Return rate - percentage of returned orders (higher value = worse customer)
When not to invert (for Churn models):
If you are building a model to estimate customer churn risk, do not invert these metrics. A higher score will then indicate a higher churn risk.
When to invert (for RFM models):
For classical RFM segmentation, invert the metrics where 'bigger = worse'. A higher score will then indicate a better customer.
A practical start:
RFM - Recency 40%, Frequency 30%, Monetary 30%.
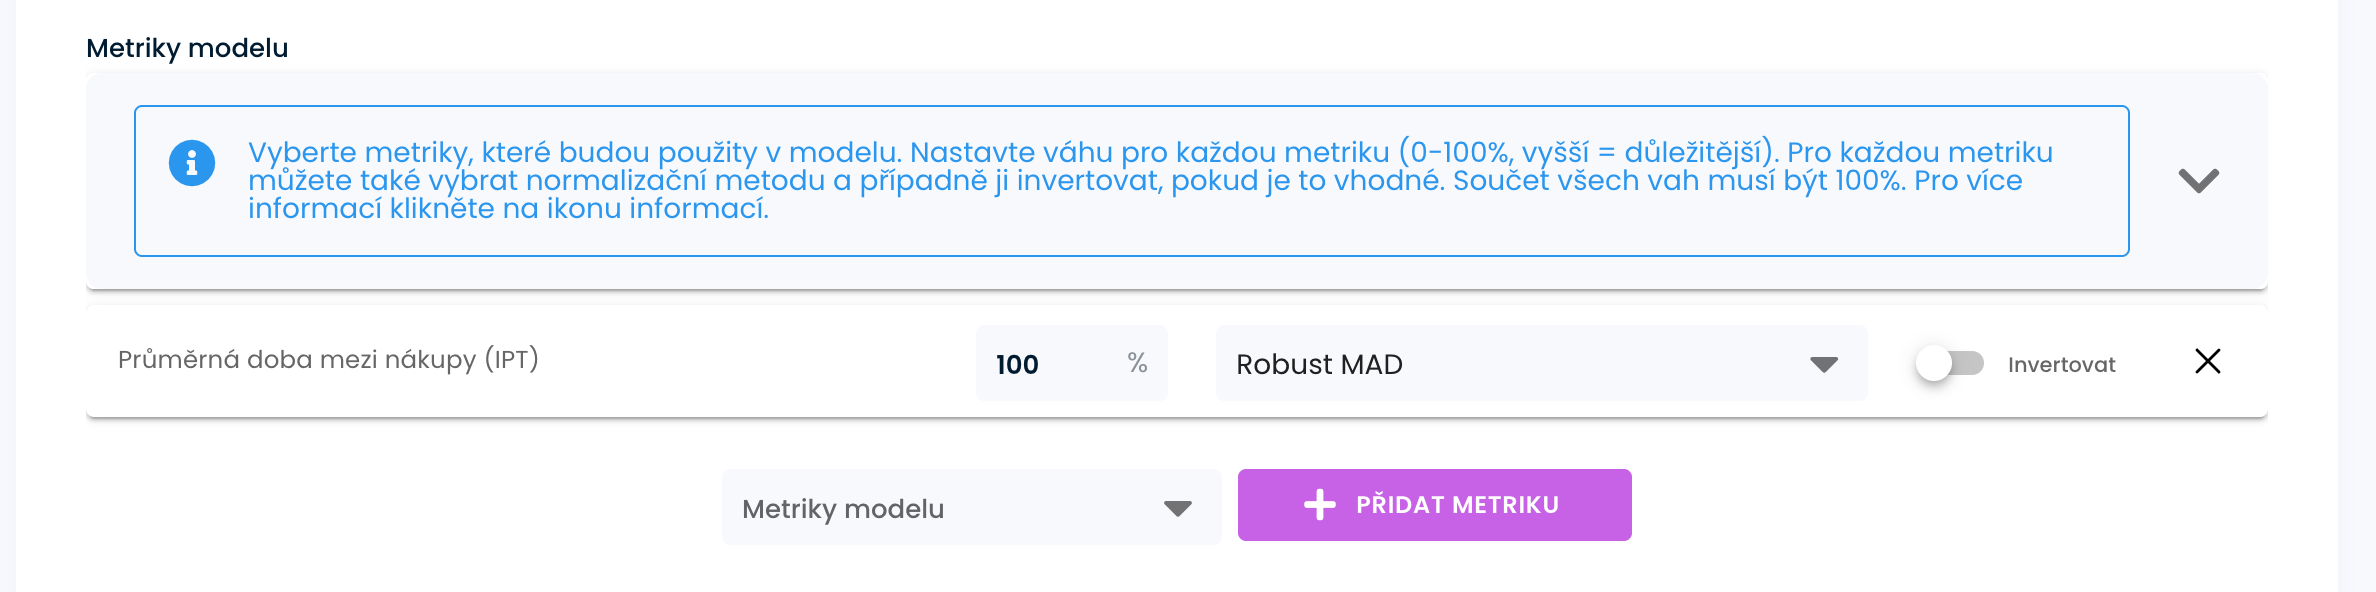
Churn - Interpurchase time 100 %
4) Set segments by score
In the Segmentation by Score section, create segments with a range of 0-100 (see the "Segmentation by Score" figure).
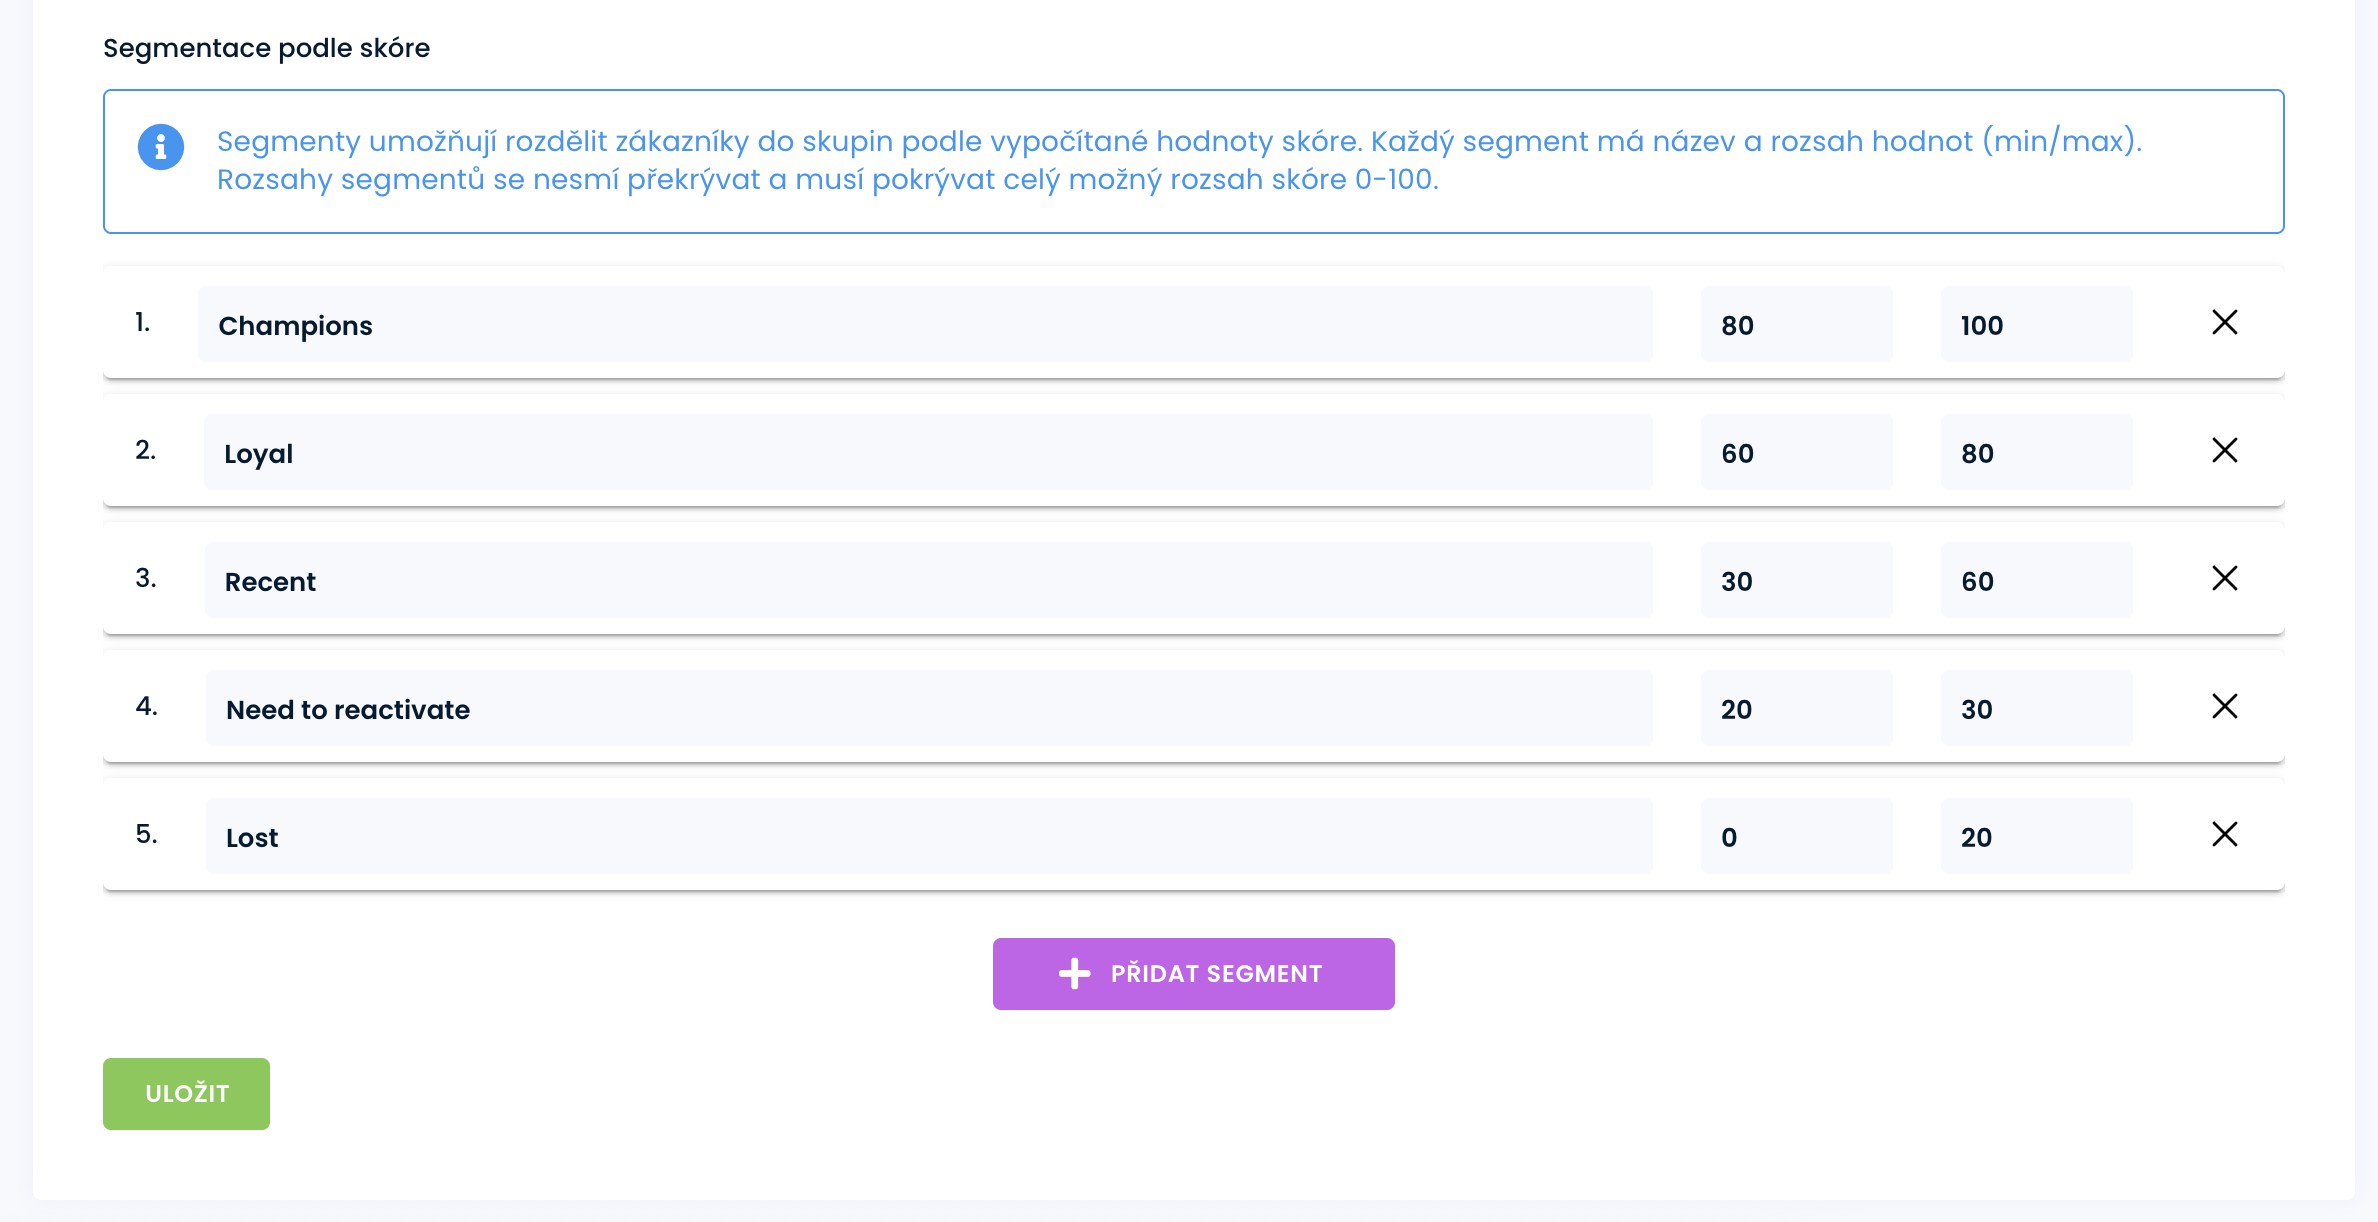
Ranges are intervals closed from the left and open from the right. They must cover the entire range 0-100 and must be contiguous.
A common template:
- Champions: 80-100
- Loyal: 60-80
- Recent: 30-60
- Need to reactivate: 20-30
- Lost: 0-20
5) Save the model
Click Save.
The model is ready for analysis (segment distribution, trends, transitions between segments, export to CSV).
How to calculate the score (simplified)
- The system retrieves the values of the selected metrics for each customer from your time window.
- Each metric is normalised to a 0-1 scale (internal methodology; the "more is better" direction is taken into account).
- Final score = sum of (metric × weight) across metrics.
- According to the score, the customer is assigned to the segment that corresponds to the specified range.
Intuition: lower recency (bought recently) → better score. Higher Frequency/Monetary → better score. Higher Return rate (more returns) → worse score, etc.
Available metrics (definitions, units, interpretation)
The metrics below correspond exactly to the implementation in the system.
- Recency - days since last purchase
- Definition: the number of days from the last order to today.
- Unit: days (integers).
- Interpretation: lower is better (bought recently).
- Monetary - total value of purchases
- Definition: sum of order values in a period.
- Unit: the currency of your account (CZK/EUR), other currencies are automatically converted according to the daily exchange rate.
- Interpretation: higher is better (more valuable customer).
- Frequency - number of purchases
- Definition: total number of orders in a period.
- Unit: number (integer).
- Interpretation: higher is better (more frequent purchases).
- Avg order value - average order value
- Definition.
- Unit: the currency of the account.
- Interpretation: higher is better (bigger basket).
- Interpurchase time - average time between purchases
- Definition: (last purchase - first purchase) / (number of purchases - 1).
- Unit: days (decimal).
- Interpretation: lower is better (buys more often).
- Note: if the customer has only 1 purchase in the period, the value is 0 (nothing to average).
- Return rate - share of returned orders - order in Shoptet status Cancelled
- Definition: 1 - (valid_count / total_count).
- Unit: proportion 0-1 (can also be displayed in %).
- Interpretation: lower is better (fewer returns = better quality purchases).
- Points used - proportion of purchases using points
- Definition: points_used_count / total_count.
- Unit: proportion 0-1 (can also be displayed in %).
- Interpretation: higher = more often applies points (sensitivity to rewards/discounts).
- Lifespan - the period of time the customer has been shopping
- Definition: (last purchase - first purchase) in days / 30, rounded to whole months.
- Unit: months (integers).
- Interpretation: higher is better (with the mark being "longer").
- Pozn.: pokud jsou < 2 nákupy, hodnota je 0.
Recommendations for setting up
- Start Simple (RFM): Recency 40%, Frequency 30%, Monetary 30%.
- Consider adding quality: add a Return rate with a lower weight (e.g. 10-20%).
- Rewards sensitivity: for loyalty programs, consider Points used (10-20%).
- Time window ≈ purchase cycle: shorter for fast moving goods (60-90 days), shorter for slow moving goods (180+).
- Subscription-friendly (coffee, shaving, etc.) - 30 days or less.
- Consumable / supplementary (food, cosmetics, supplements) - 30-90 days.
- Fashion & Accessories - 90-180 days.
- Hobby / seasonal - 180-365 days.
- Long life (electronics, furniture) -365 days
- Mixed - at your discretion, for example 180 days.
- Segments: keep clear boundaries, no overlaps, covering 0-100.
- Naming: specify the model name with the period (e.g. "RFM 180d").
The most common errors
- Weights do not give 100% → model cannot be saved.
- Overlapping segments or uncovered range 0-100 → customers would not line up correctly, model cannot be saved.
- Inappropriate time window → distorted metrics (e.g. too short for slow assortment).
- Ignoring returns → no quality control (recommended to monitor Return rate).
Recommended actions for segments in RFM analysis
Below you will find practical tips on how to work with the segments defined in the model (e.g. Champions, Loyal, Recent, Need to reactivate, Lost). Based on Recency, Frequency, Monetary and additional metrics (e.g. Return rate, Points used).
Champions (80-100)
Goal: maintain satisfaction and value of purchases, build ambassadors.
- VIP care and exclusivity: priority access to new releases, limited editions, early-access promotions, pre-orders.
- Rewards without heavy discounts: bonus points, gifts with your order, free shipping - save margin.
- Referral & UGC: activate referral program, send motivation for reviews/photos.
- Personalisation: recommendation of premium/bundle products by history.
- KPI: AOV (average order value), NPS/review, repeat purchase rate.
Loyal (60-79)
Goal: increase frequency and basket value, move up to Champions.
- Loyalty motivators: step rewards (milestones), double points on certain days.
- Cross-sell/upsell: smart add-ons to last purchased items, subscriptions.
- Program benefits: club rates, longer return periods, service benefits.
- Automation: reminders of consumer goods according to interpurchase time.
- KPI: Frequency, AOV, Points used.
Recent (30-59)
Goal: to push for a 2nd purchase and create a habit.
- Onboarding series: thank you notes, "how to get the most out of your product", tips and tricks.
- Second purchase with a slight incentive: a small bonus instead of an across-the-board discount - a gift with your order.
- Timing by Recency: a reminder when habitual customers make their next purchase.
- Reduce barriers: free shipping over a certain amount, easy selection of accessories.
- KPIs: conversion to 2nd purchase, time to 2nd purchase, AOV of 2nd purchase.
Need to reactivate (20-29)
Goal: prevent dropout, restore the habit.
- Win-back campaigns: limited offer with clear deadlines (bonus points, gifts, save margin).
- Reason for leaving: short satisfaction survey (quality, price, transport); offer a solution.
- Relevant news: show new collections/alternatives for your last purchase.
- Channels with low CPA: email/SMS push before paid ads.
- KPIs: reactivation (return within 30 days), change in recency, estimate of CLV after reactivation.
Lost (0-19)
Goal: decide who else to approach and who to "let go".
- Cheap, one-time attempts: repermission e-mail, sale/clearance, last offer.
- Segmentation by value: high Monetary → consider individual proposition; low value → limit costly channels.
- Database cleanliness: unsubscribe inactive contacts (deliverability, reputation).
- Remarketing as acquisition: work with them as new customers.
- KPIs: reactivation, email deliverability, cost per attempt vs. margin gained.
Tips across segments
- Return rate↑: reduce discount aggression, offer better education on size/variant selection, improve descriptions.
- Points used↑: build campaigns on points (boosters, 2× points days), but watch the profit.
- Use interpurchase time for timing reminders and replenishment campaigns.
- ProductAnalysis: recommend combinations of products that are commonly bought together.
- Test email subject lines, incentive and timing per segment; monitor impact on CLV and margin.
Where to use the model next
- Customer list - filter by model and segment. Customer segmentation in set models is calculated automatically once a day.
- Reports - segment distribution, transitions between segments over time, metrics development, CSV export for transfer to analytics platforms.
- Campaigns & loyalty - targeting rewards and reactivation offers through external services.
Availability and automatic calculations
A limited number of analytical models are available in the trial version.
If Ellity BI is enabled, the system automatically recalculates customer segmentation 1 time per day during night hours and always takes into account the previous day's data.
In addition, detailed report calculations can be run to compare both customer distributions between segments and transitions between segments between two selected days. These detailed outputs include for each customer its current segment, the total score, as well as the input values of the metrics used for the calculation. The complete dataset can be downloaded as a CSV for further processing in external tools.
