


Goal: Quickly understand customer behavior, evaluate the impact of the loyalty program and translate the findings into concrete actions (campaigns, discounts, care, assortment).
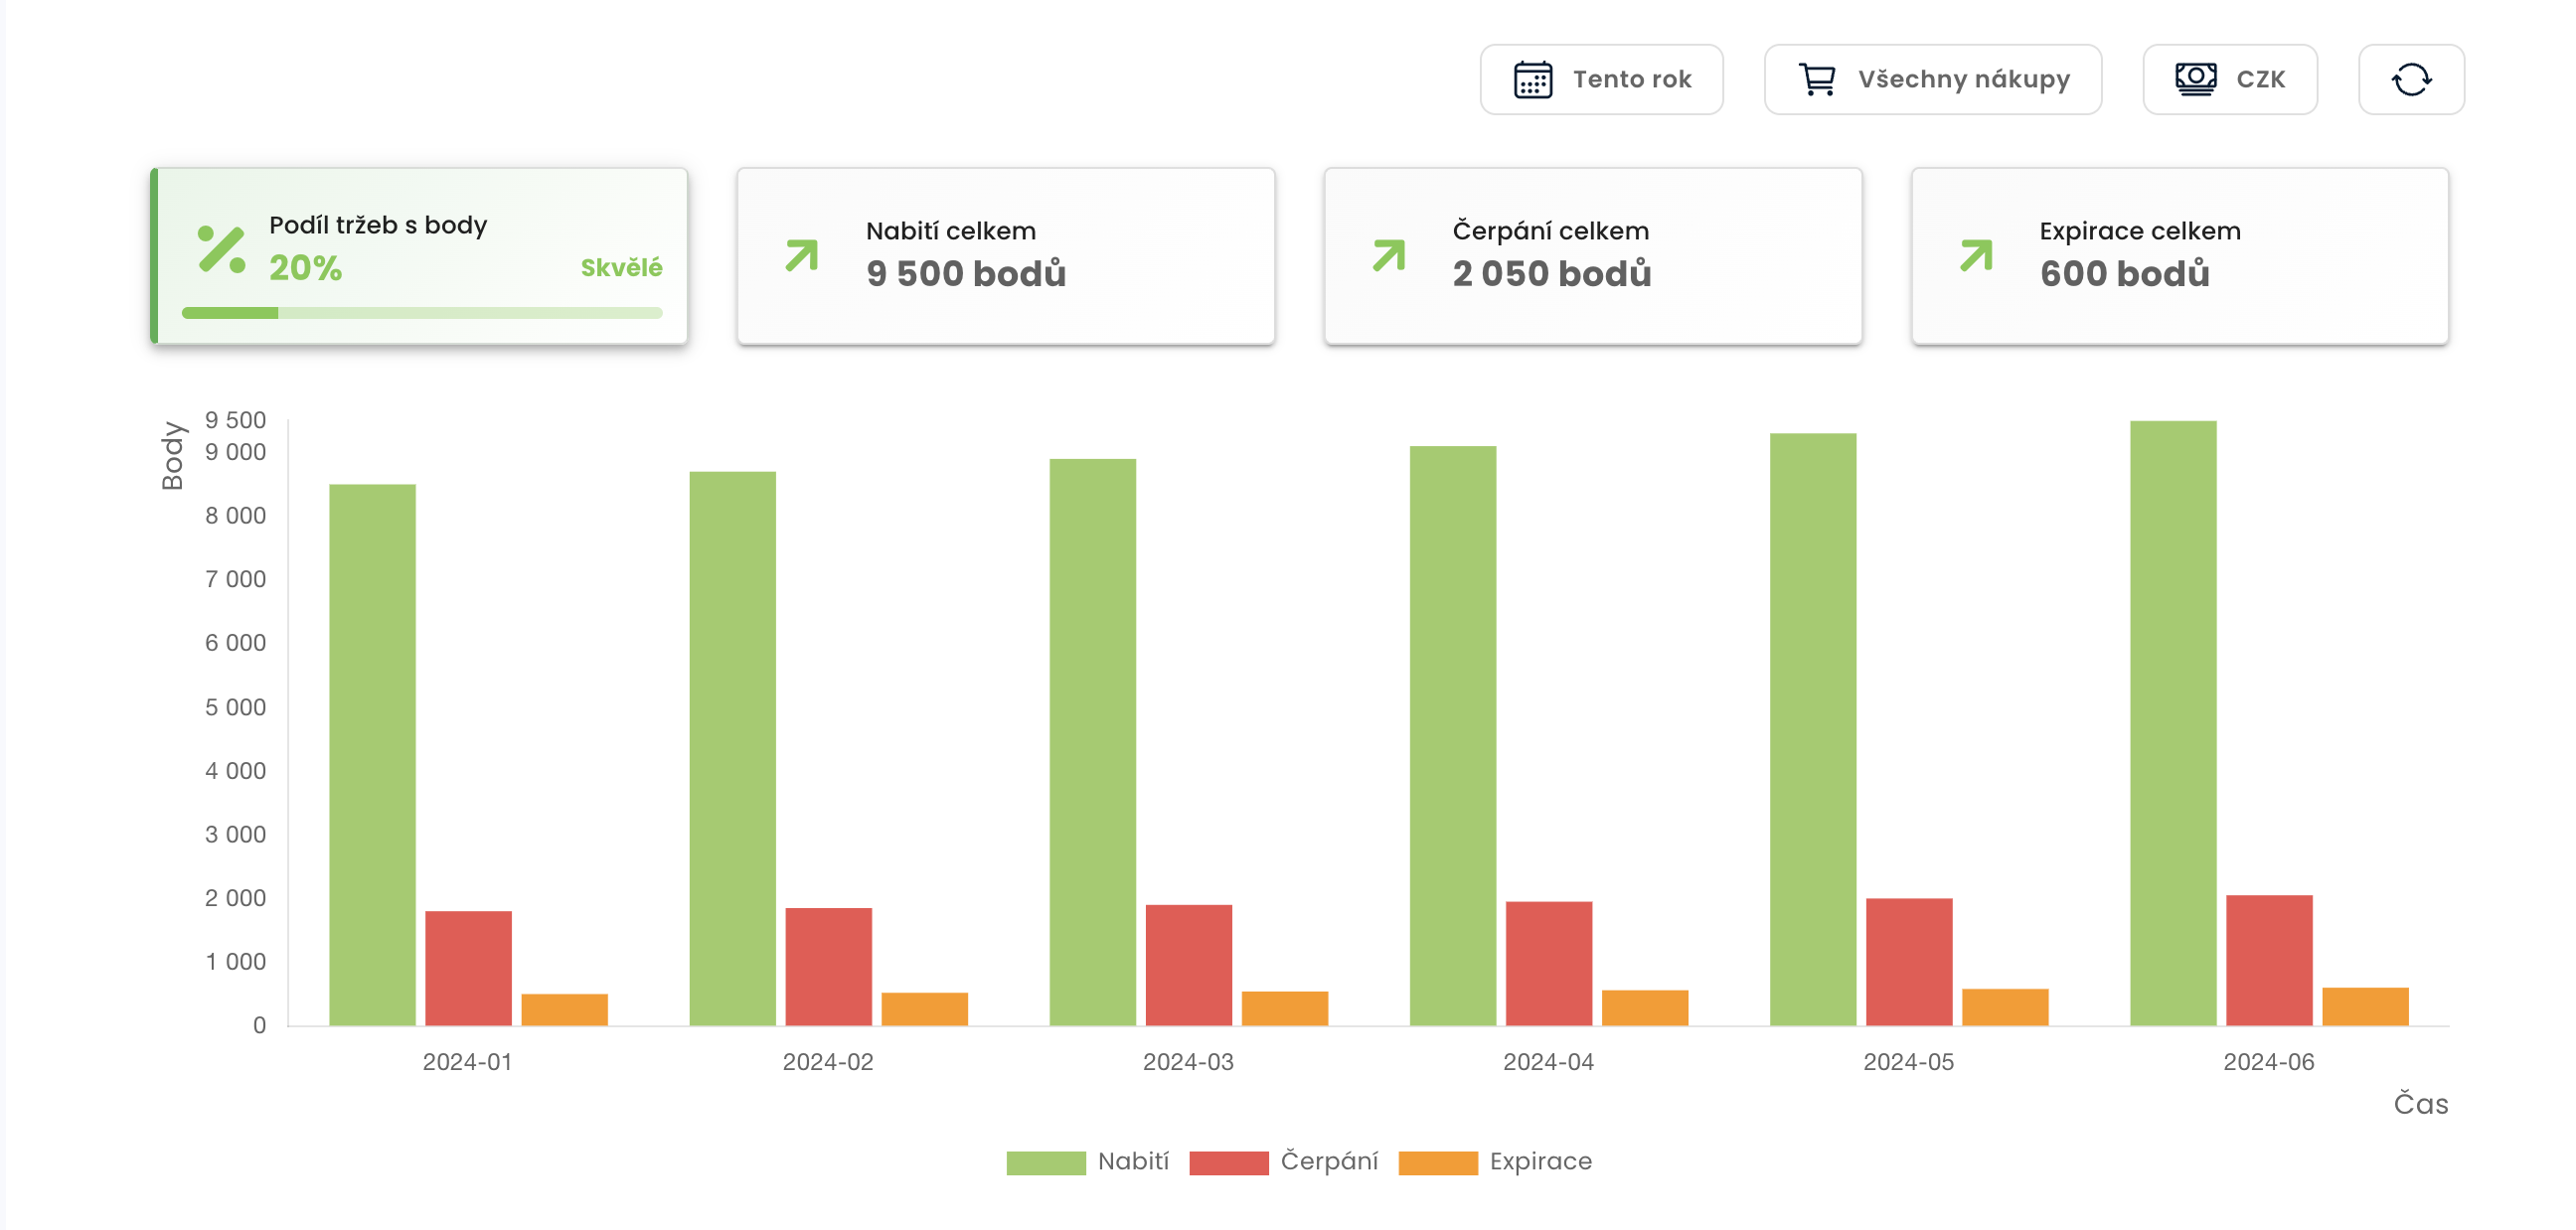
Overview of points and credits
What it is
It tracks how points are charged and redeemed, how many orders have been placed with credit and whether points are being forfeited.
How to read it (example)
- Points offered: 9,500 (+11.8%)
- Points redeemed: 2,050 (+13.9%)
- Points forfeited: 600 (+20%)
What to make of it
- Expirations (points forfeited) are rising - perhaps expiration reminders are missing or the application bar is too high.
Action steps
- Expiry campaigns: to remind of the impending expiry.
- Boosters (2× points on slow days) for demand management.
- Application rules: lower the minimum threshold if there is a high proportion of unused points.
Analytical overview of customers
What it is
Visualizes the distribution of customers into segments (e.g. RFM model) and transitions between segments over time.
You can set up different analytical models. An analytics model is a set of rules that evaluate customer behavior using selected metrics. Each customer gets a score (0-100) and is assigned to a segment (e.g. Champions, Loyal, Lost).
With the model, you'll quickly know who's most valuable to you, who's on their way out, and who's worth sending a reactivation or loyalty offer to.
Helps manage retention and reactivation.
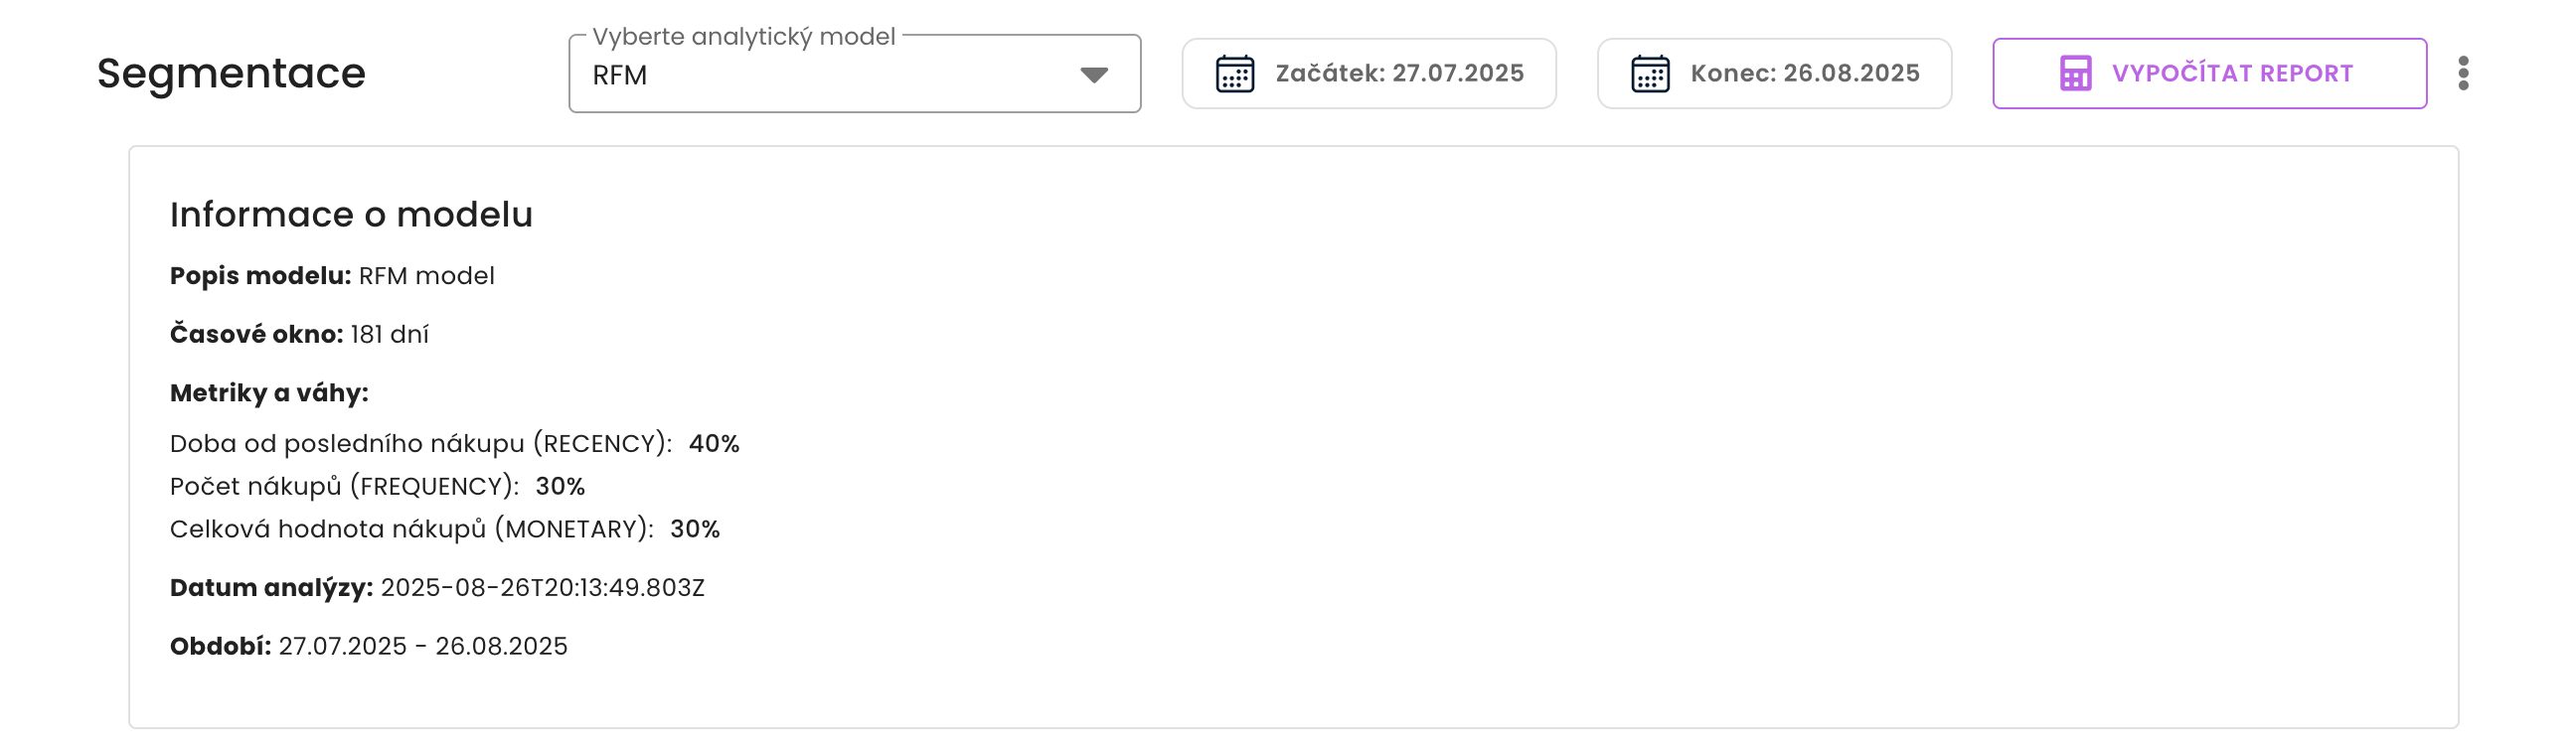
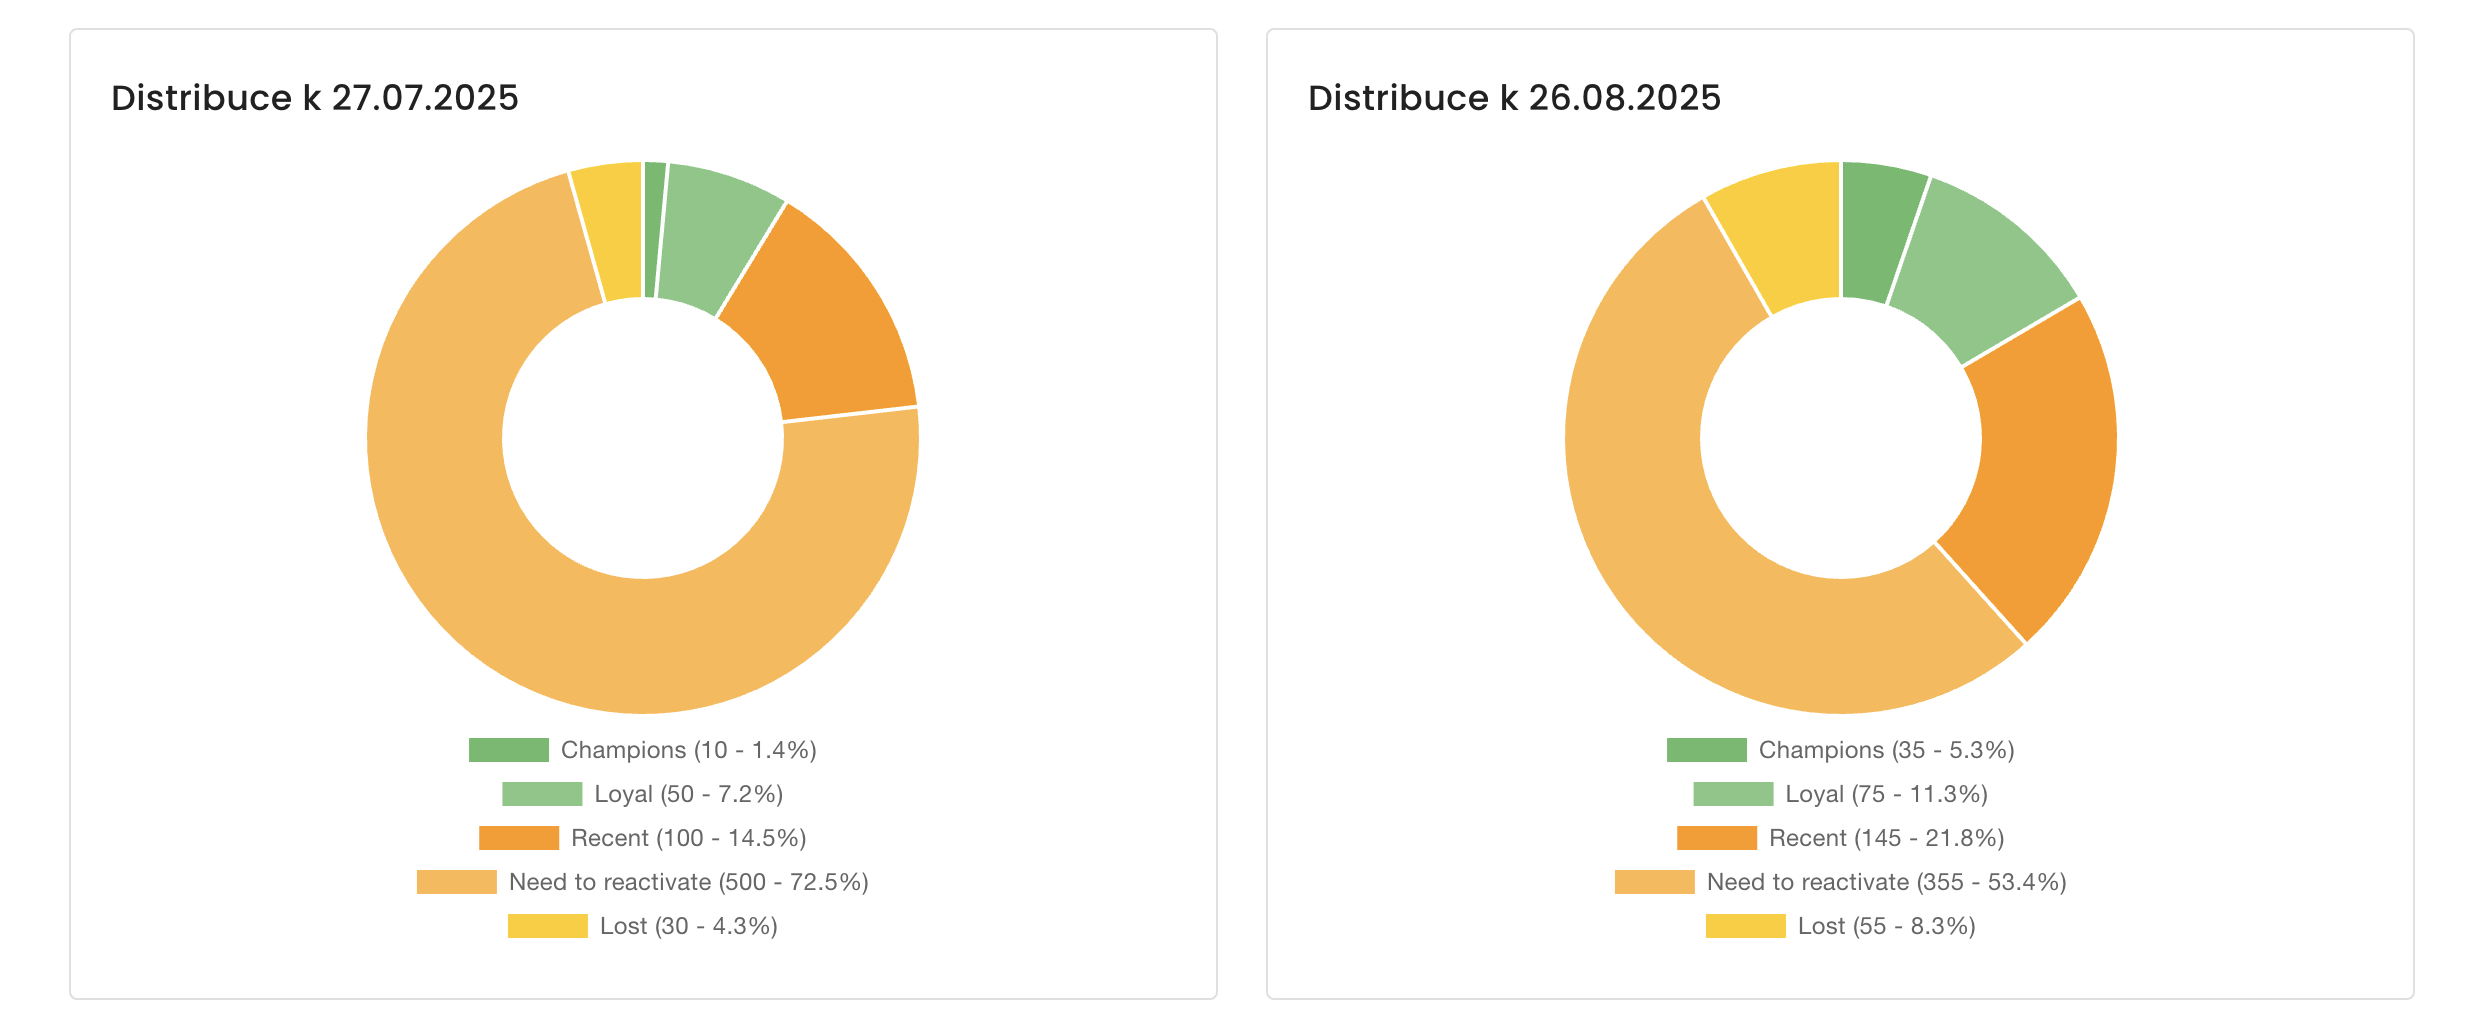
How to read it (using data as an example)
Customer segmentation
- Start of Period: Champions 10, Loyal 50, Recent 100, Need to reactivate 500, Lost 30
- End of season: Champions 35, Loyal 75, Recent 145, Need to reactivate 355, Lost 55
- Interpretation: portfolio quality is increasing - Champions+Loyal from 60 to 110 (+83%). Need to reactivate segment dropped from 500 to 355 (-29%). Lost slightly increased (+25) → worth checking why (product, price, delivery).
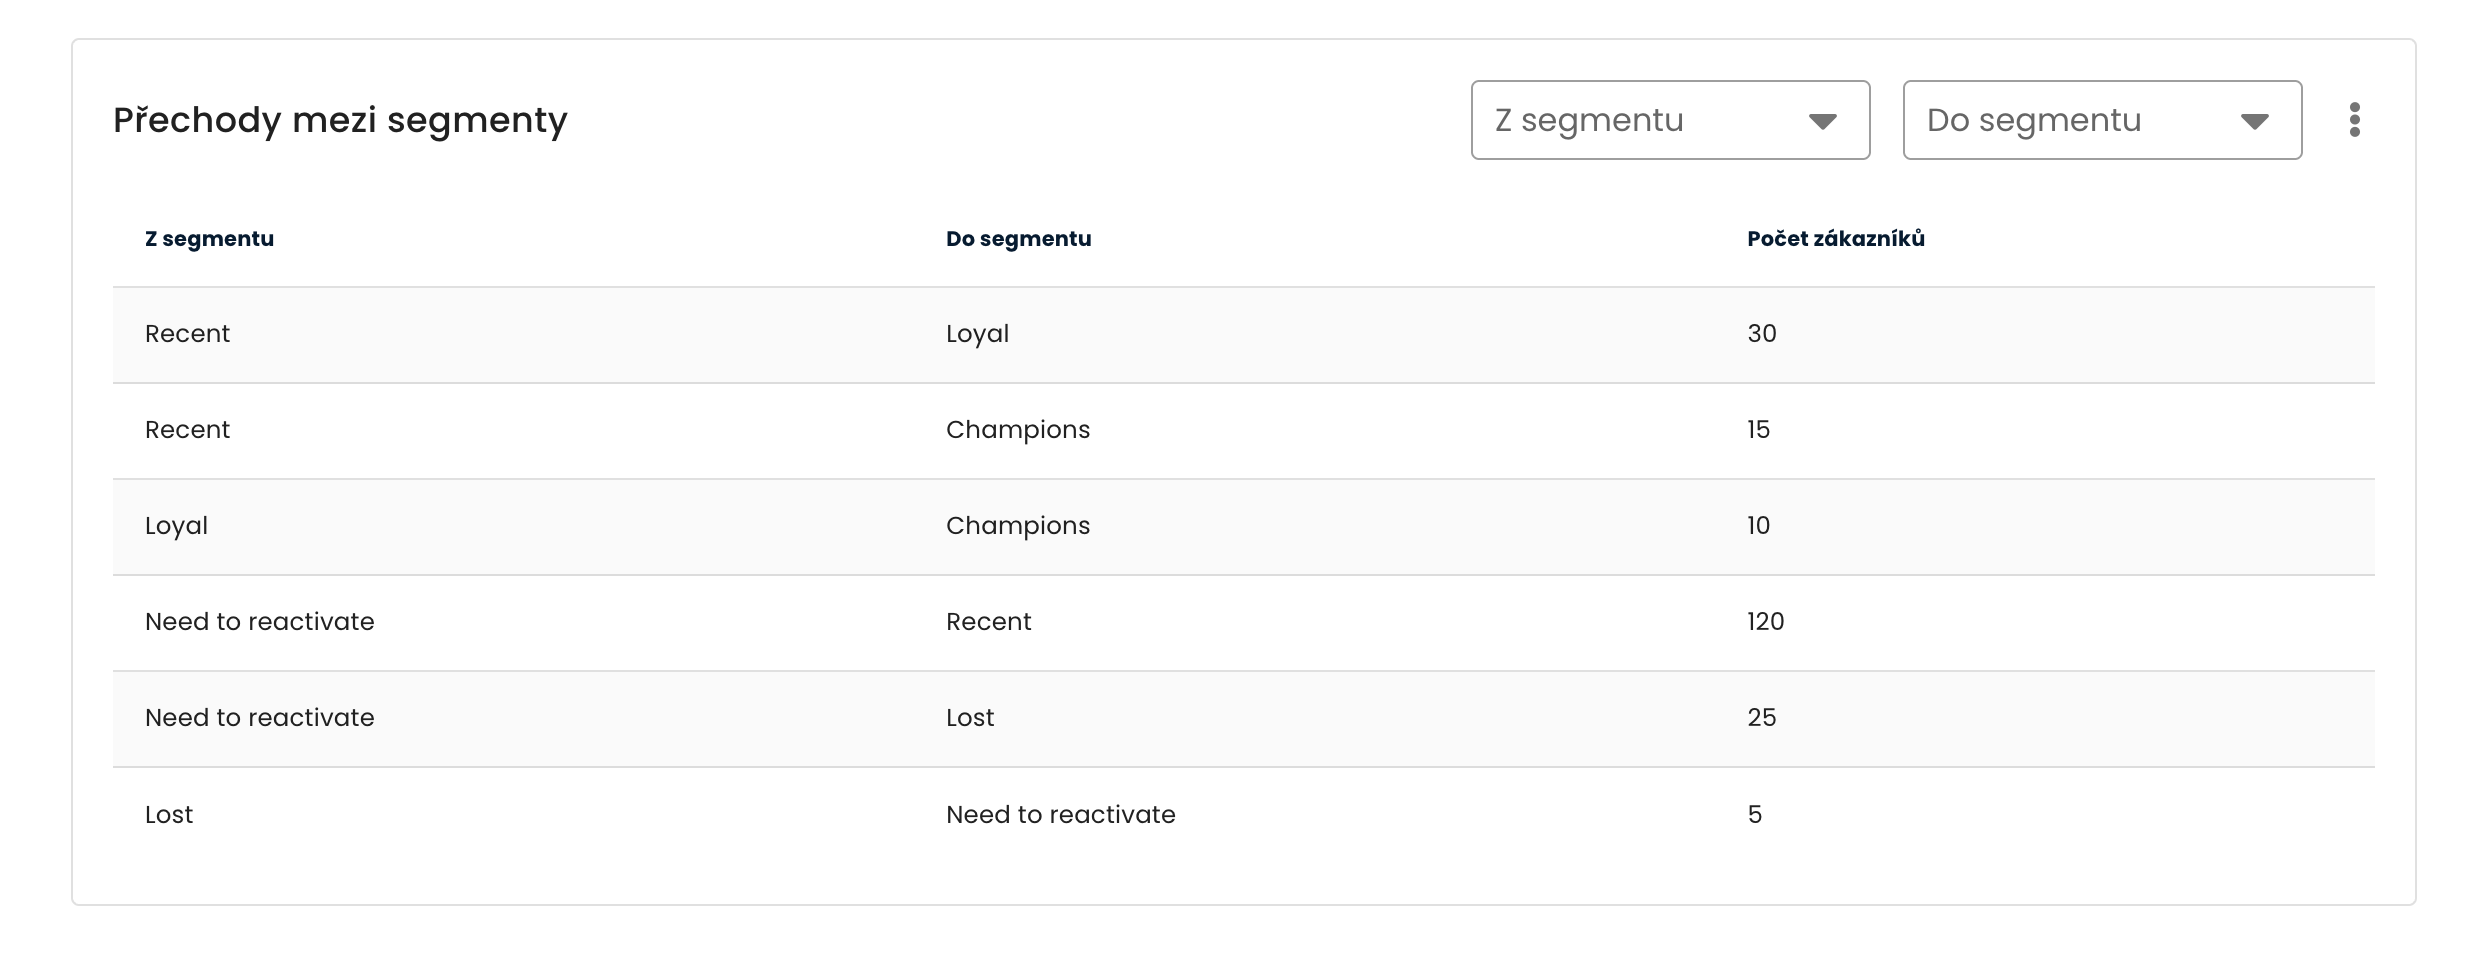
Transitions between segments
- Recent → Loyal: 30 (succeeded in working on the second purchase and increasing the frequency)
- Recent → Champions: 15 (fast acceleration of valuable customers)
- Loyal → Champions: 10 (effective upsell/bundly)
- Need to reactivate → Recent: 120 (successful win-back campaigns)
- Need to reactivate → Lost: 25 (part of reactivation failed)
-
Transitions between segments
What to make of it
- Positive trend: more people are moving "up" (Recent/Loyal → Champions) than "down".
- Risk: small increase in Lost - focus on reasons (returns, availability, price).
Action steps
- Champions/Loyal: early-access, gifts instead of discounts, referral incentive bonus.
- Recent: series of onboarding emails + offer for 2nd purchase (bonus points).
- Need to reactivate: targeted win-back campaigns with clear deadlines + reminders of relevant news.
- Lost: cheap attempts (repermission), possibly "letting go" and cleaning the database.
Tip: The "Detailed Report" (CSV) provides segment, total score and metric values for each customer, so you can filter and target campaigns very precisely.
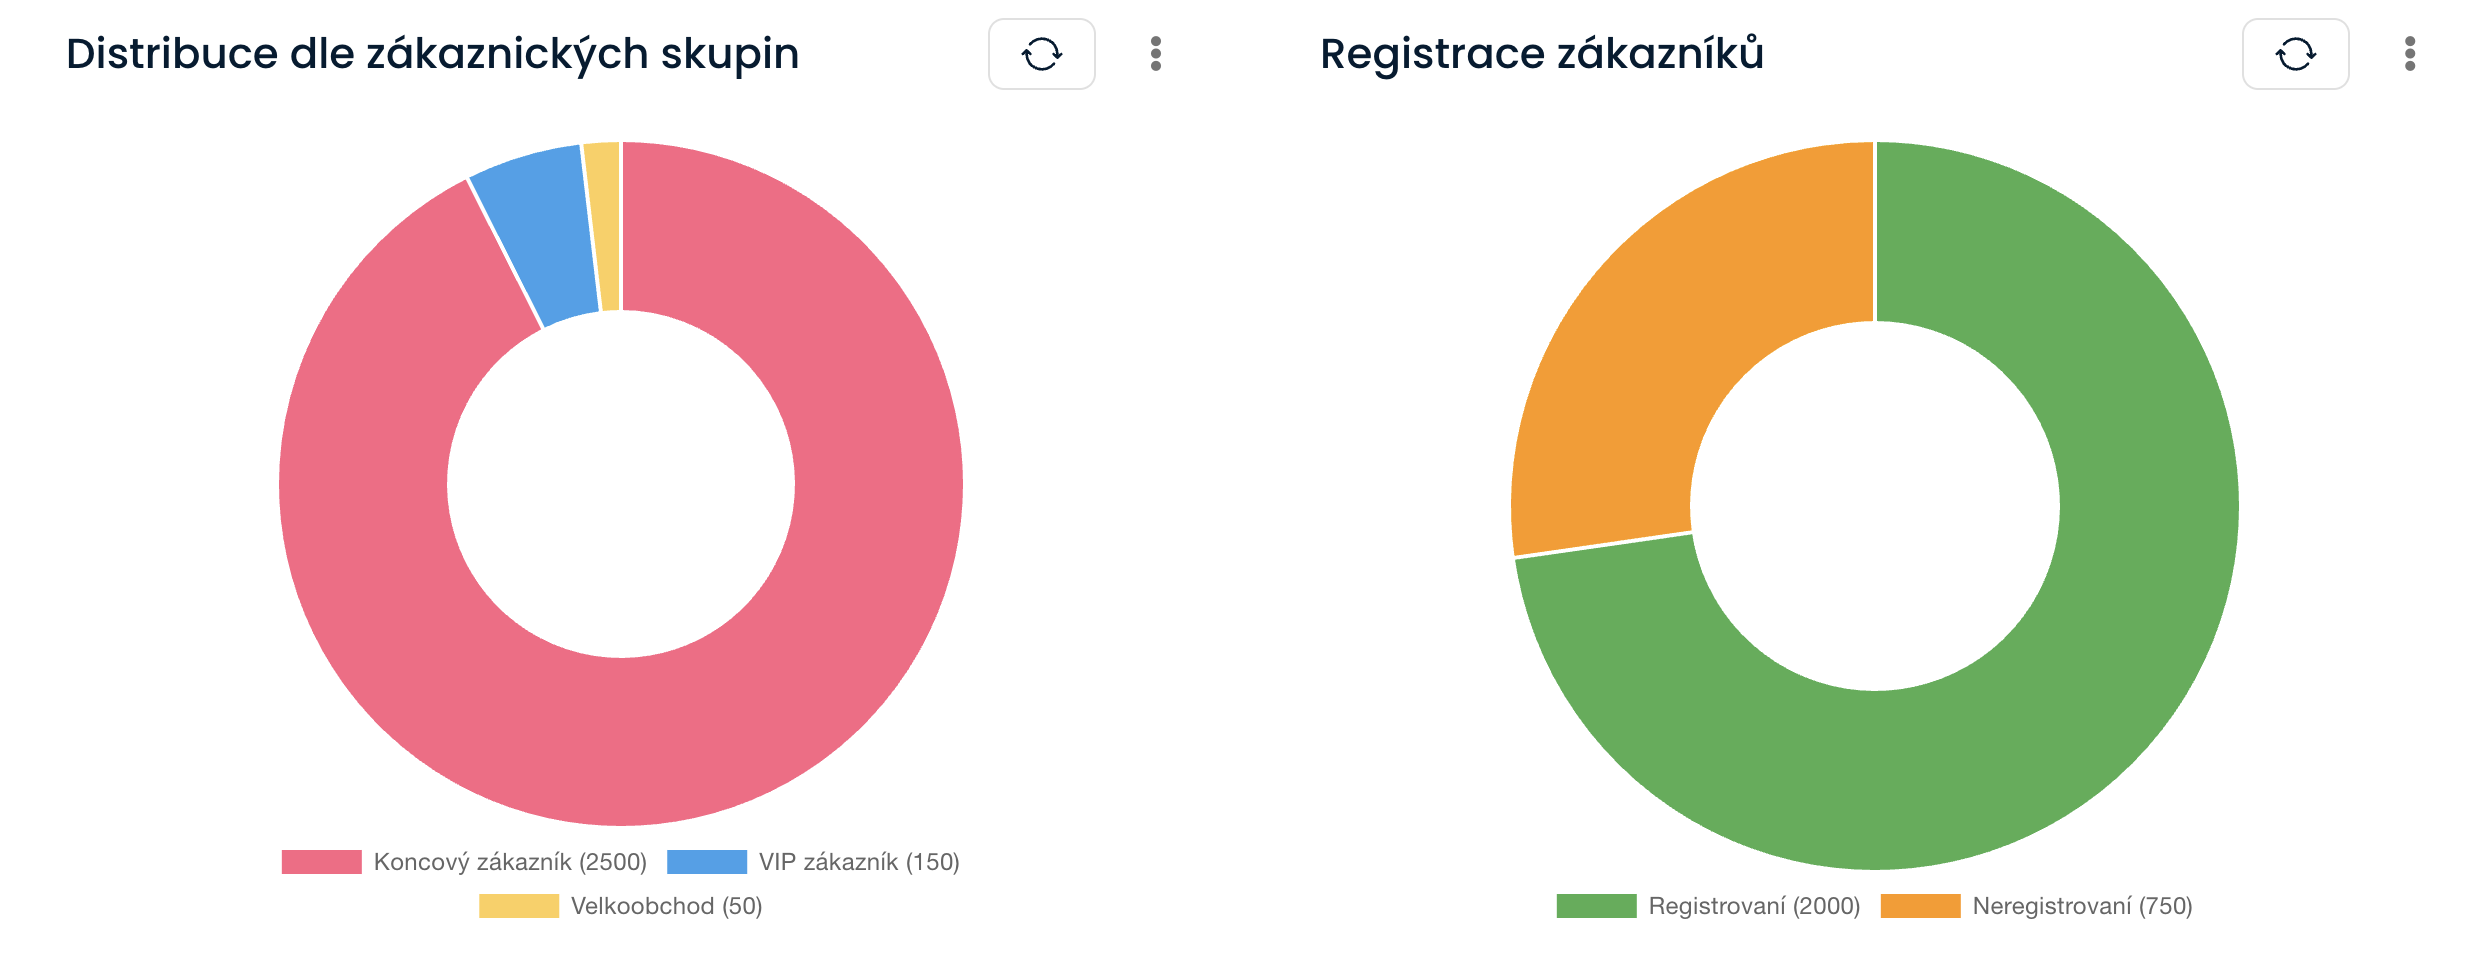
Group segmentation (customer type)
What it is
Distribution of customers by customer groups. For example, into end-user, VIP and wholesale - helping to fine-tune pricing, benefits and service.
How to read it (example)
- End customer 2 500, VIP 150, Wholesale 50.
Customer registration
What it is
Ratio of registered vs. unregistered - key for personalization options.
How to read it (example)
- Registered 2 000, Unregistered 750, Total 2 750.
Action steps
- Motivation to register: points to start, faster checkout, loyalty program benefits and registration visible to the customer at a glance.
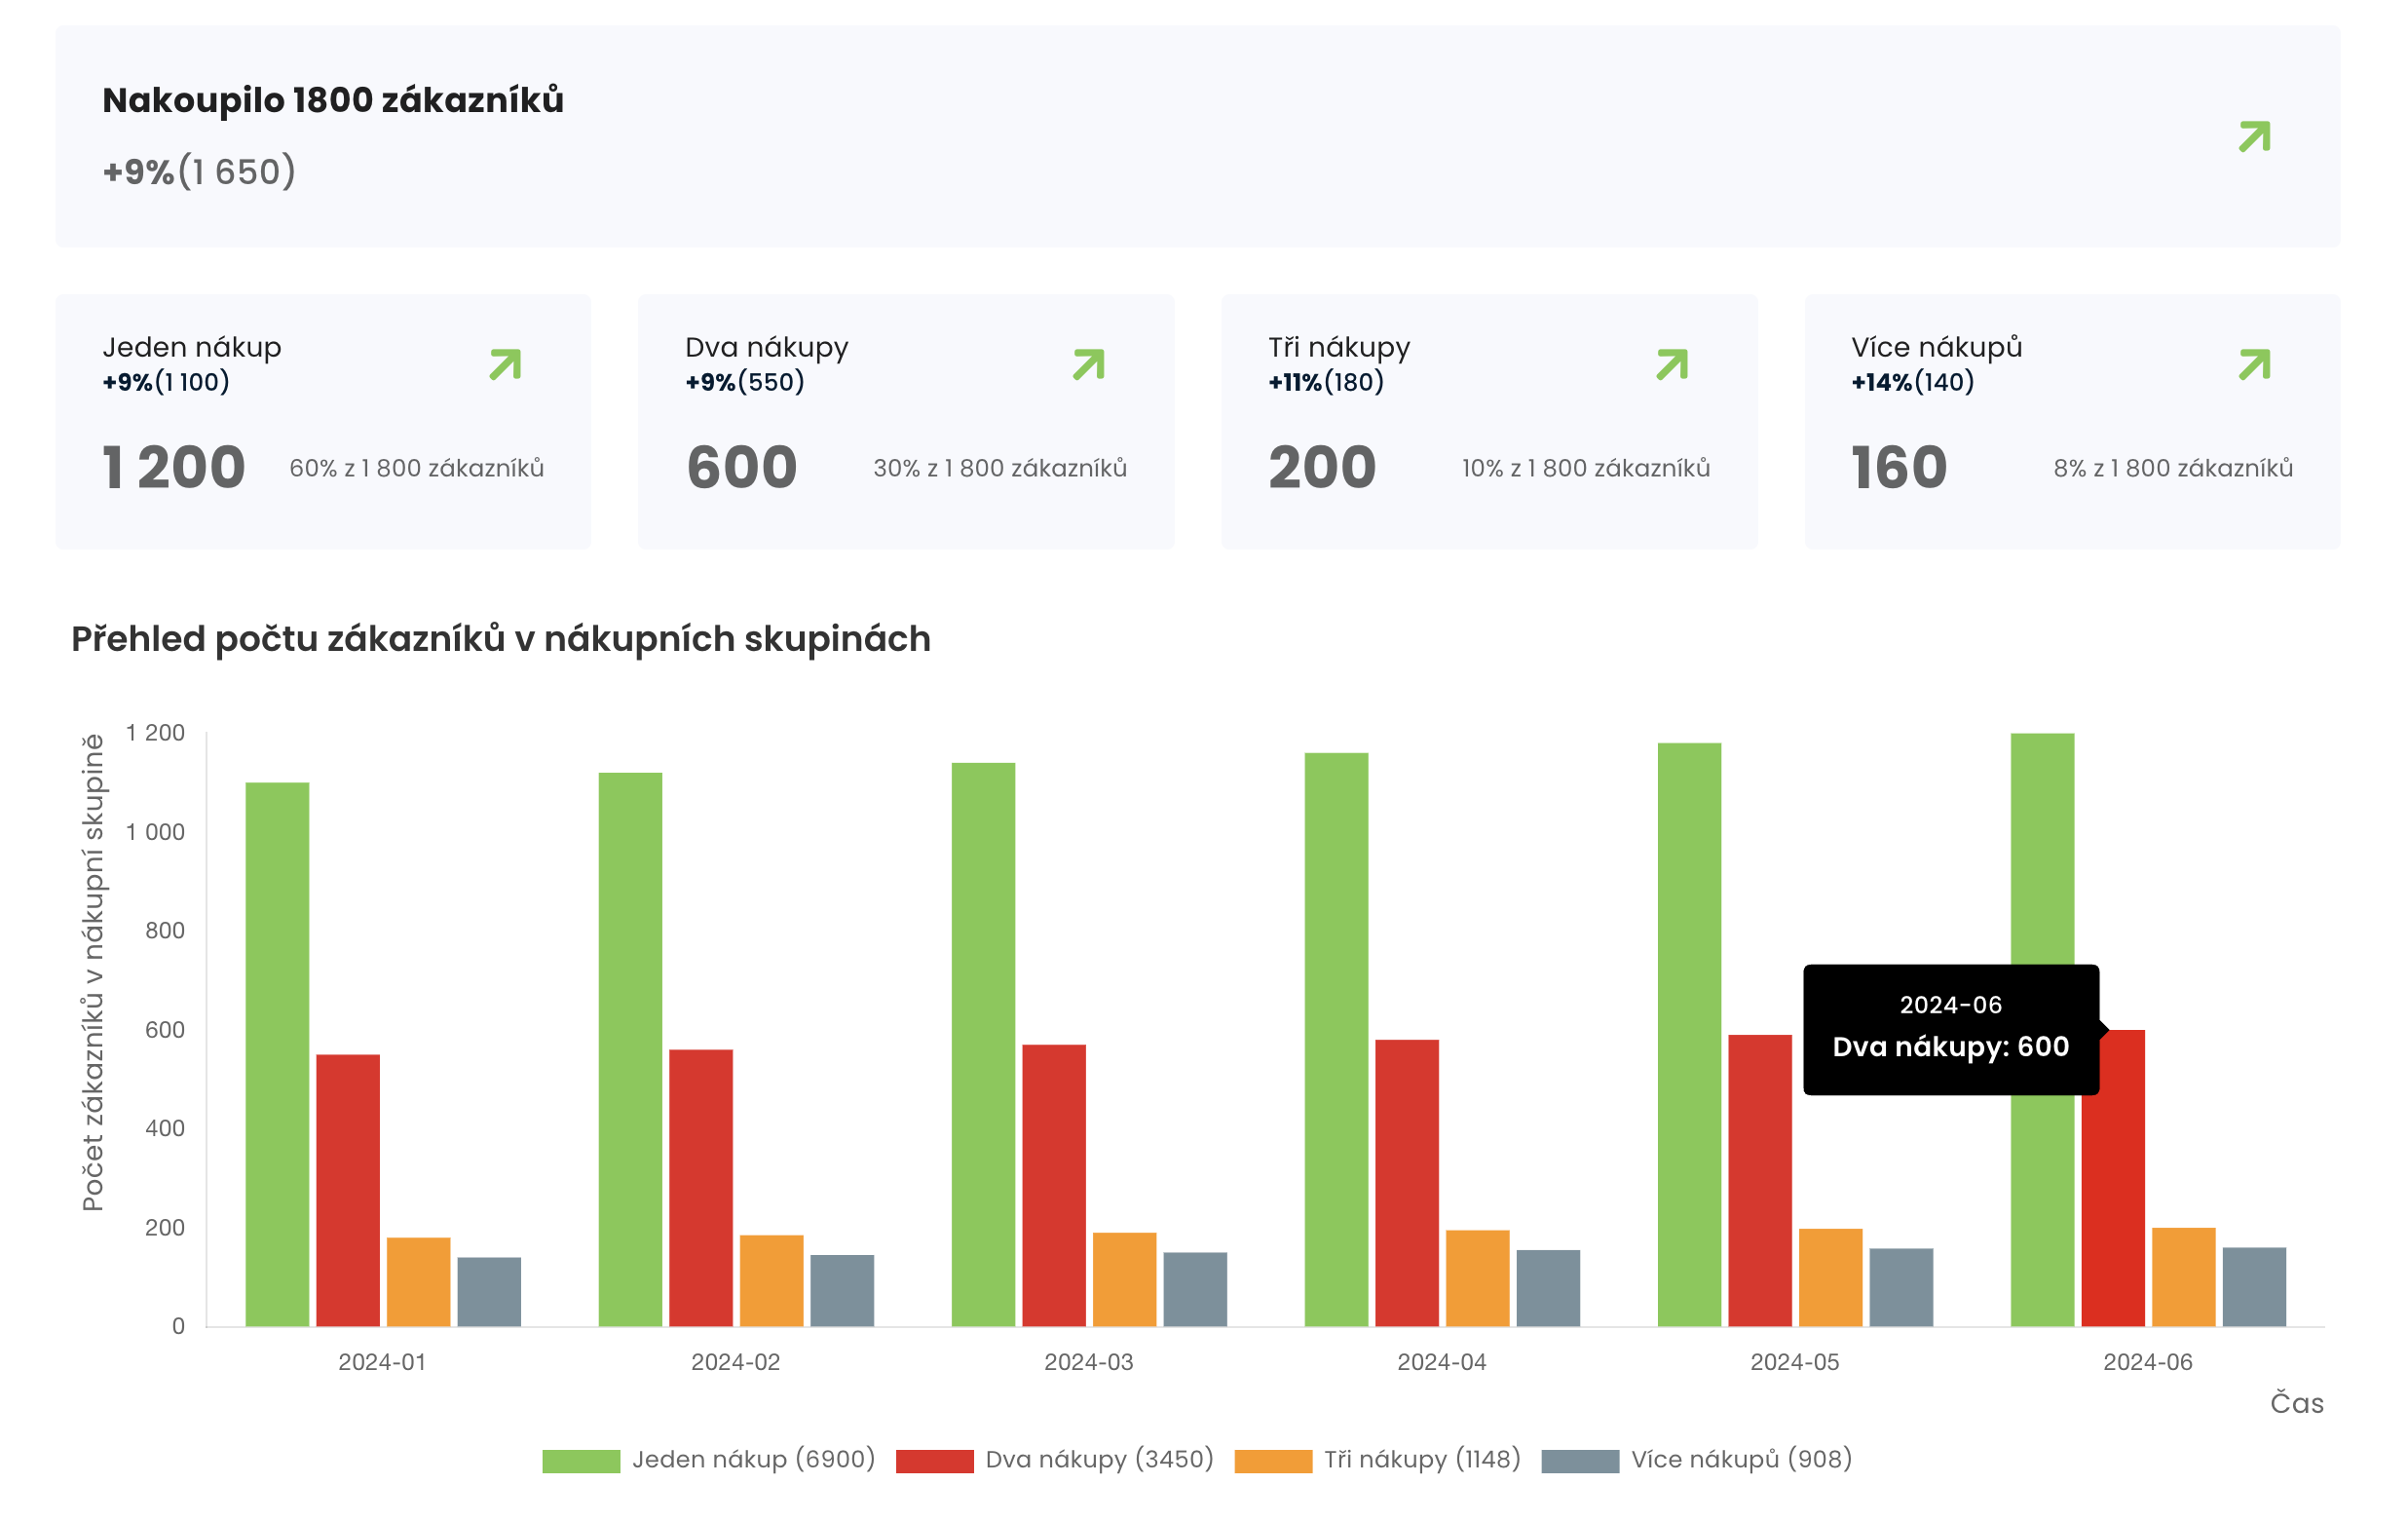
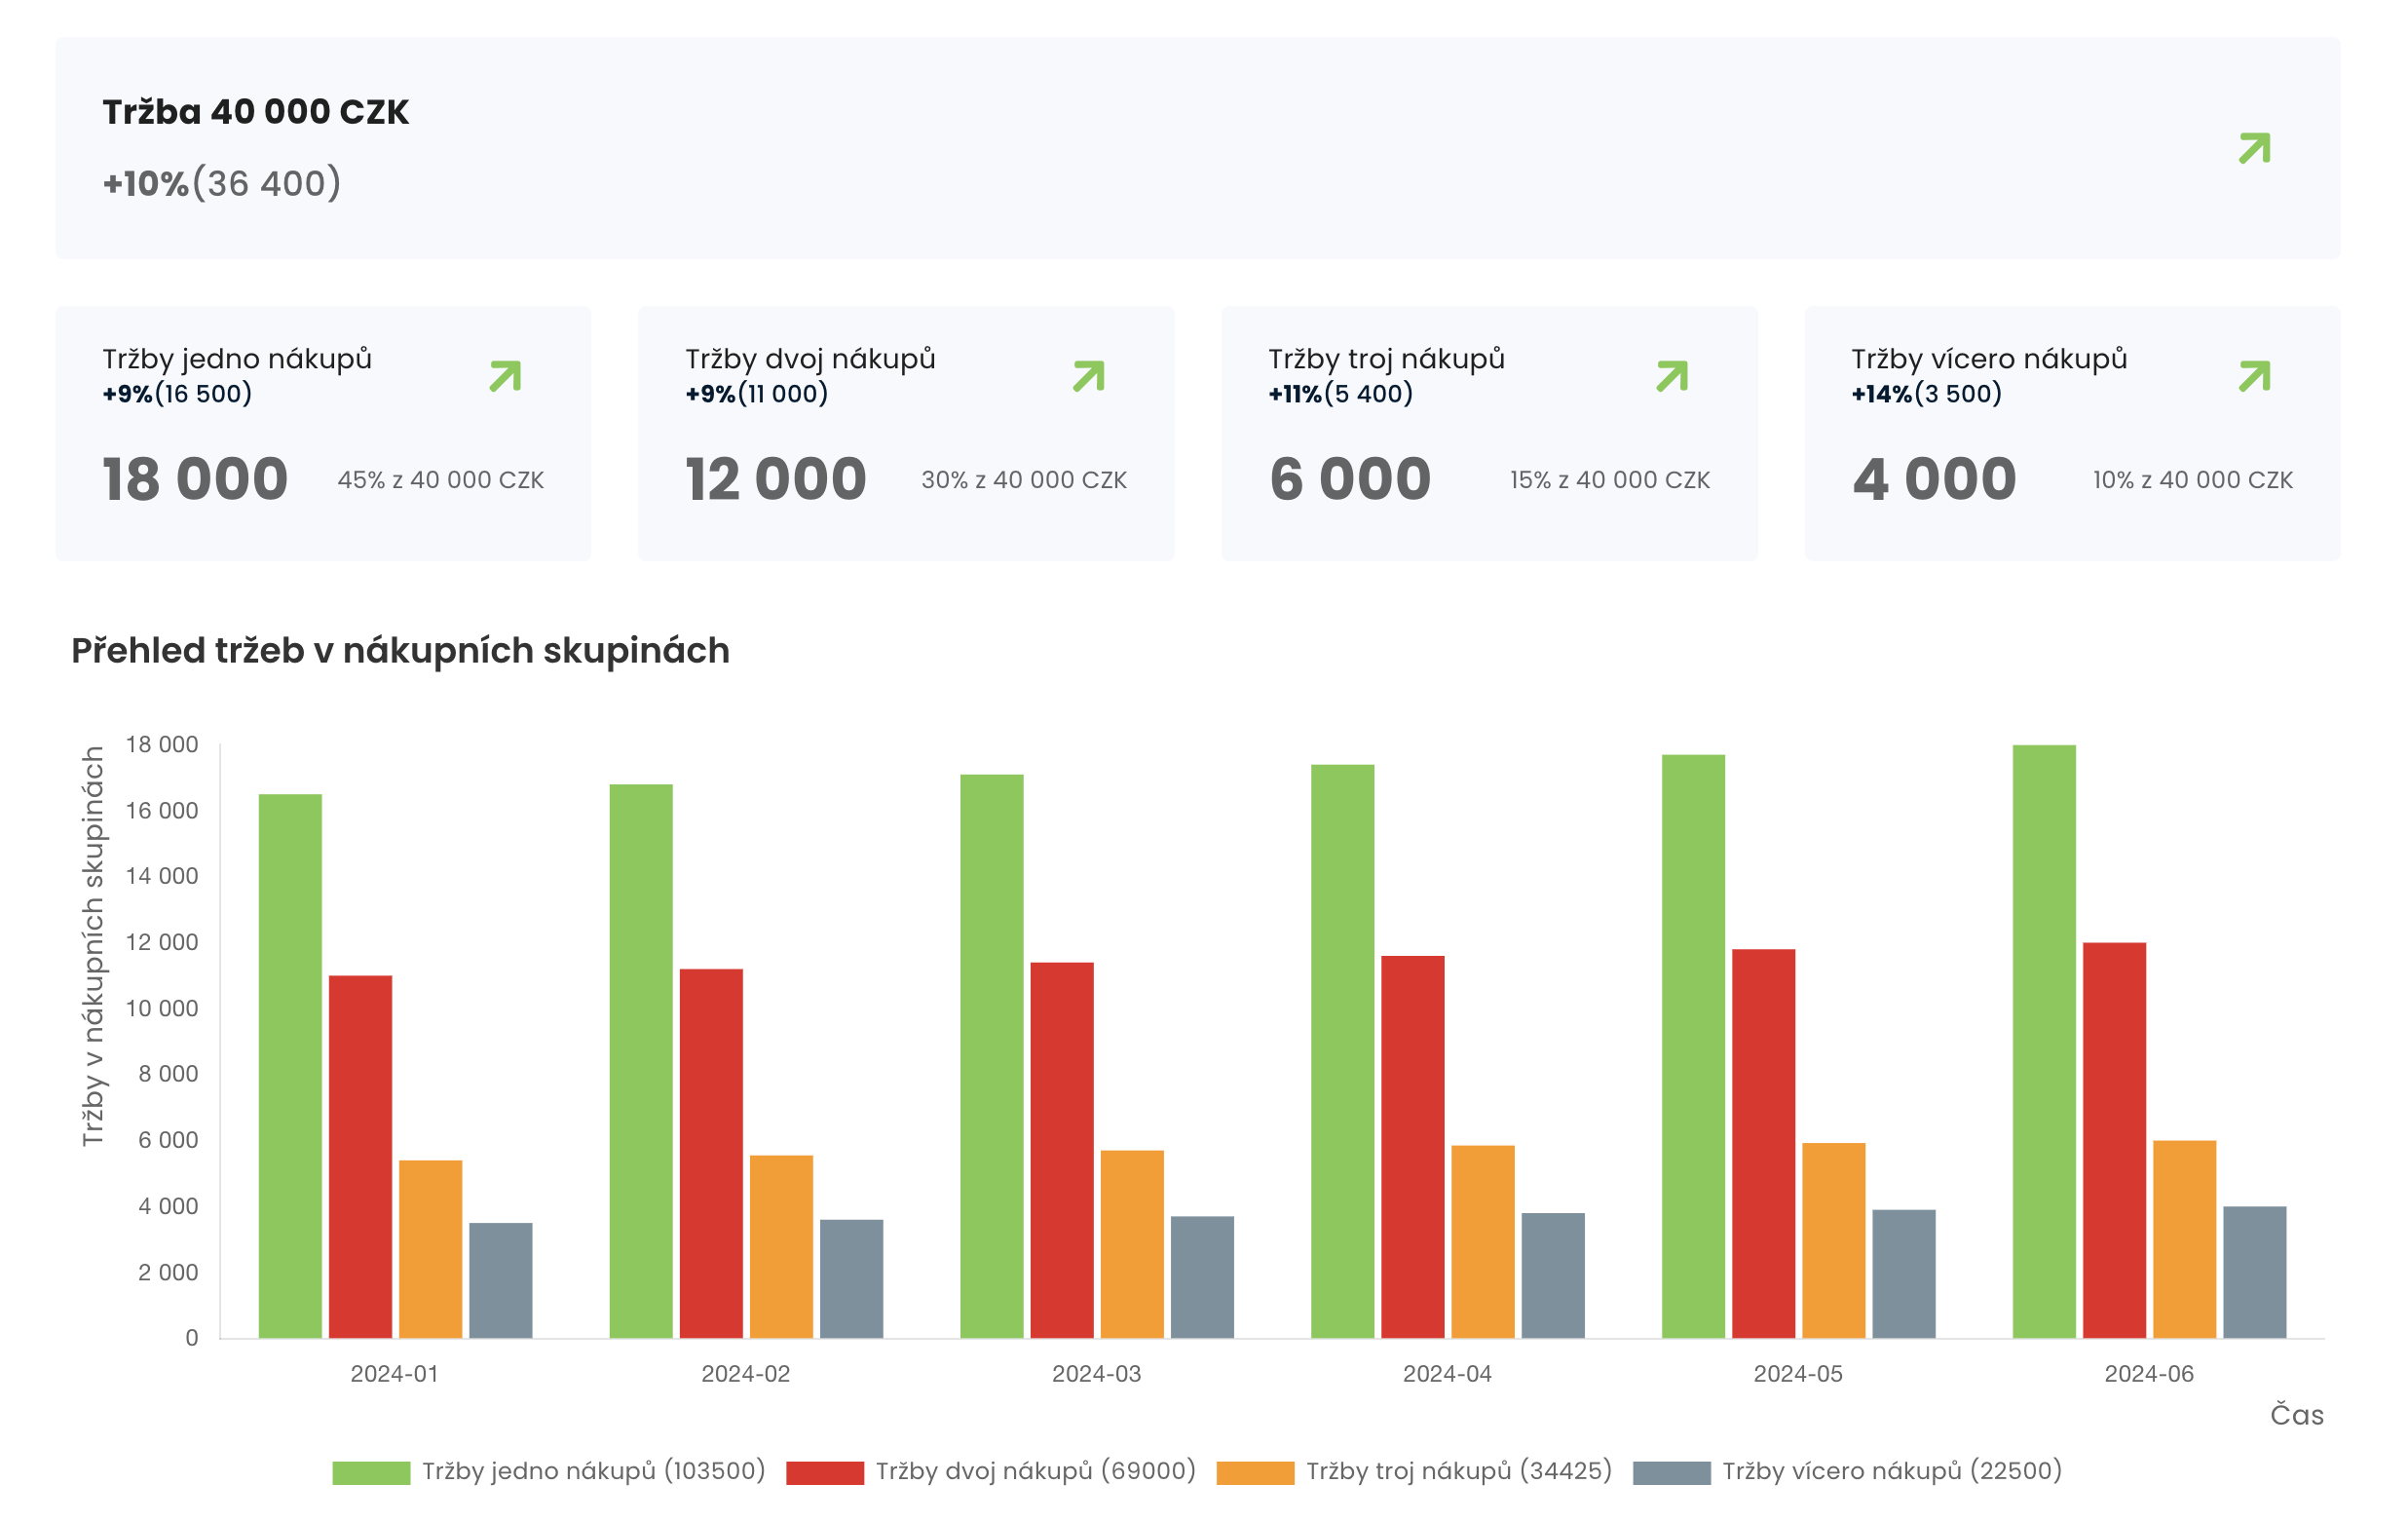
Overview of purchases
What it is
It breaks down customers by number of purchases and shows key revenue metrics.
How to read it (example)
- 1 purchase: 60% (1,200 customers), customers with exactly 1 purchase
- 2 purchases: 30% (600), customers with exactly 2 purchases
- 3 purchases: 10% (200), customers with exactly 3 purchases
- 4+ purchases: 8% (160), customers with 4 or more purchases
- These figures show the total number of customers for the whole period.
- The graph below the values then shows the numbers of customers in these groups at each time point.
- The actual values for the whole period are not the sum of the values in the graph. These are different time periods. The graph is used to monitor the evolution of the distribution in groups.
- Key metrics for the period: sales 40 000 CZK (+9.9%), ASP in the period, trends in individual groups (One purchase +9% etc.)
What to make of it
- High proportion of one-purchase → potential for onboarding and second-purchase offers.
- The growth in AOV and active customers confirms that the campaigns and product are working.
Action steps
- Replenishment and reminders according to typical interpurchase time.
- Bundly/cross-sell to increase AOV.
- Special promotion for 3+ purchases to become Loyal/Champions.
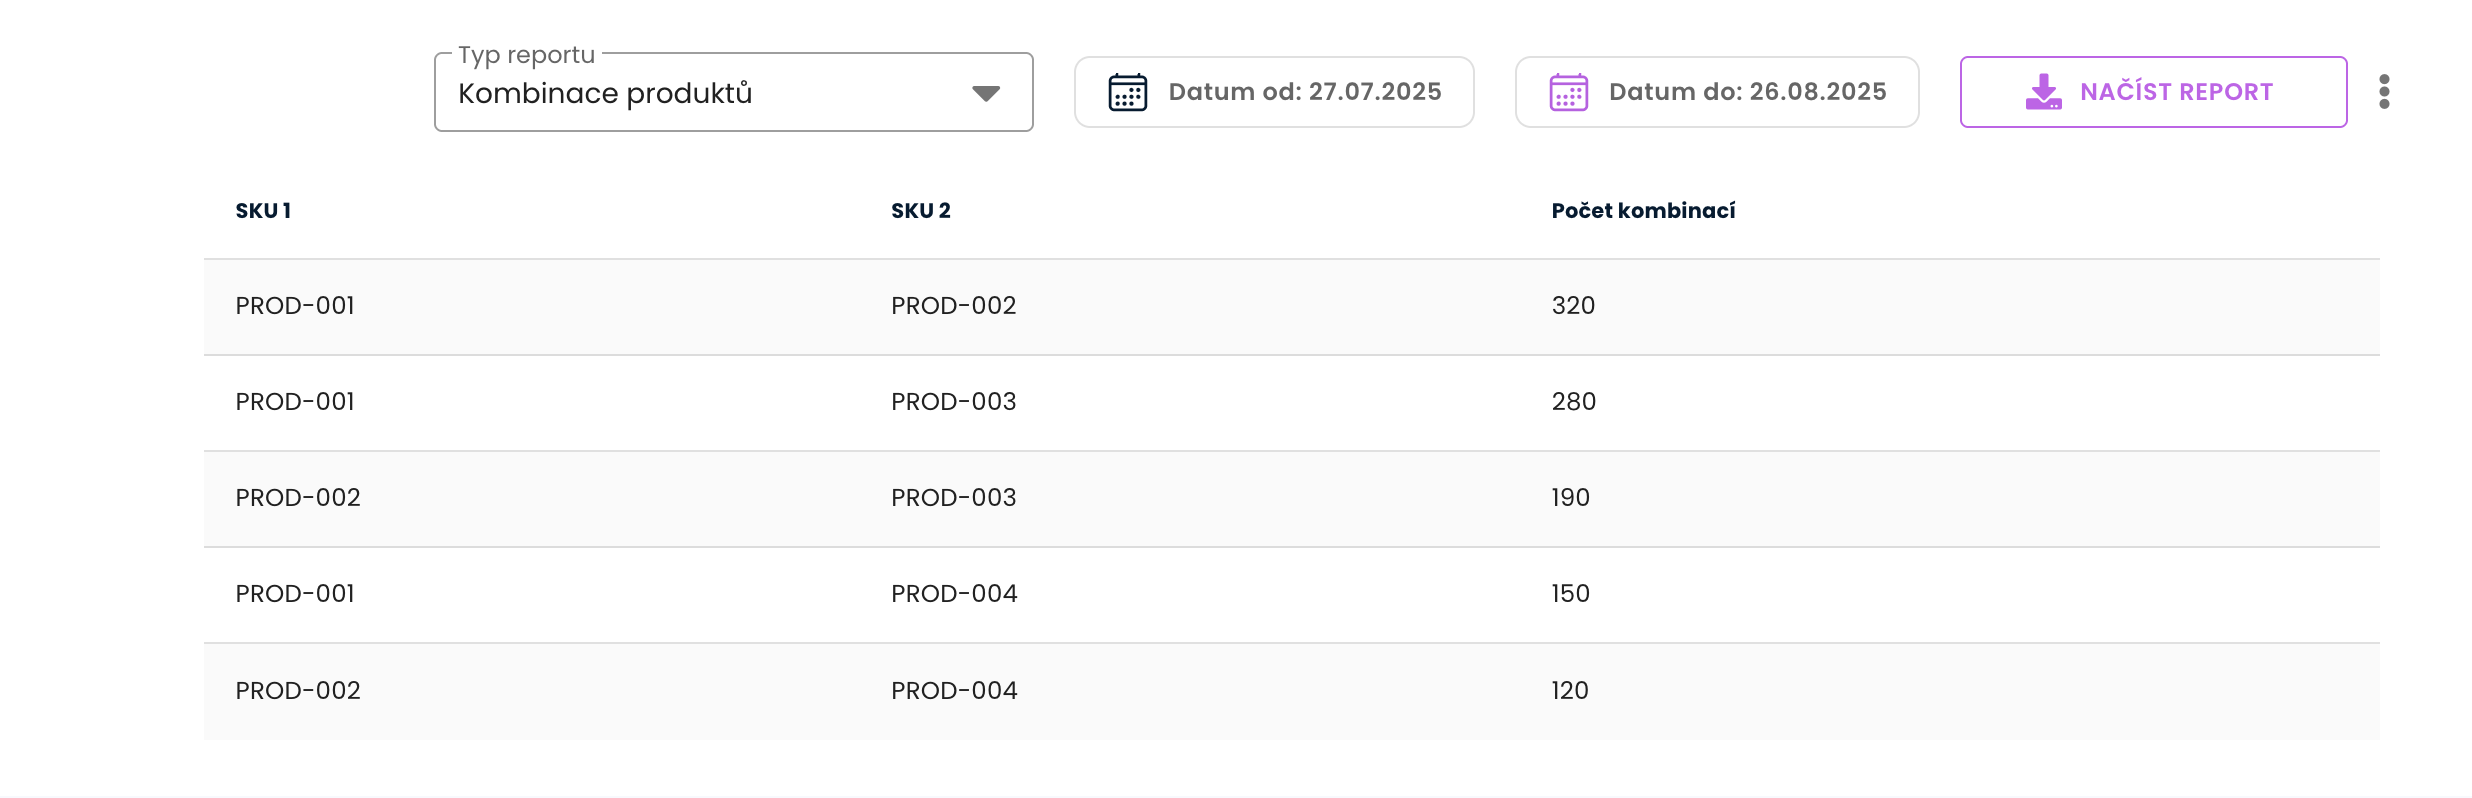
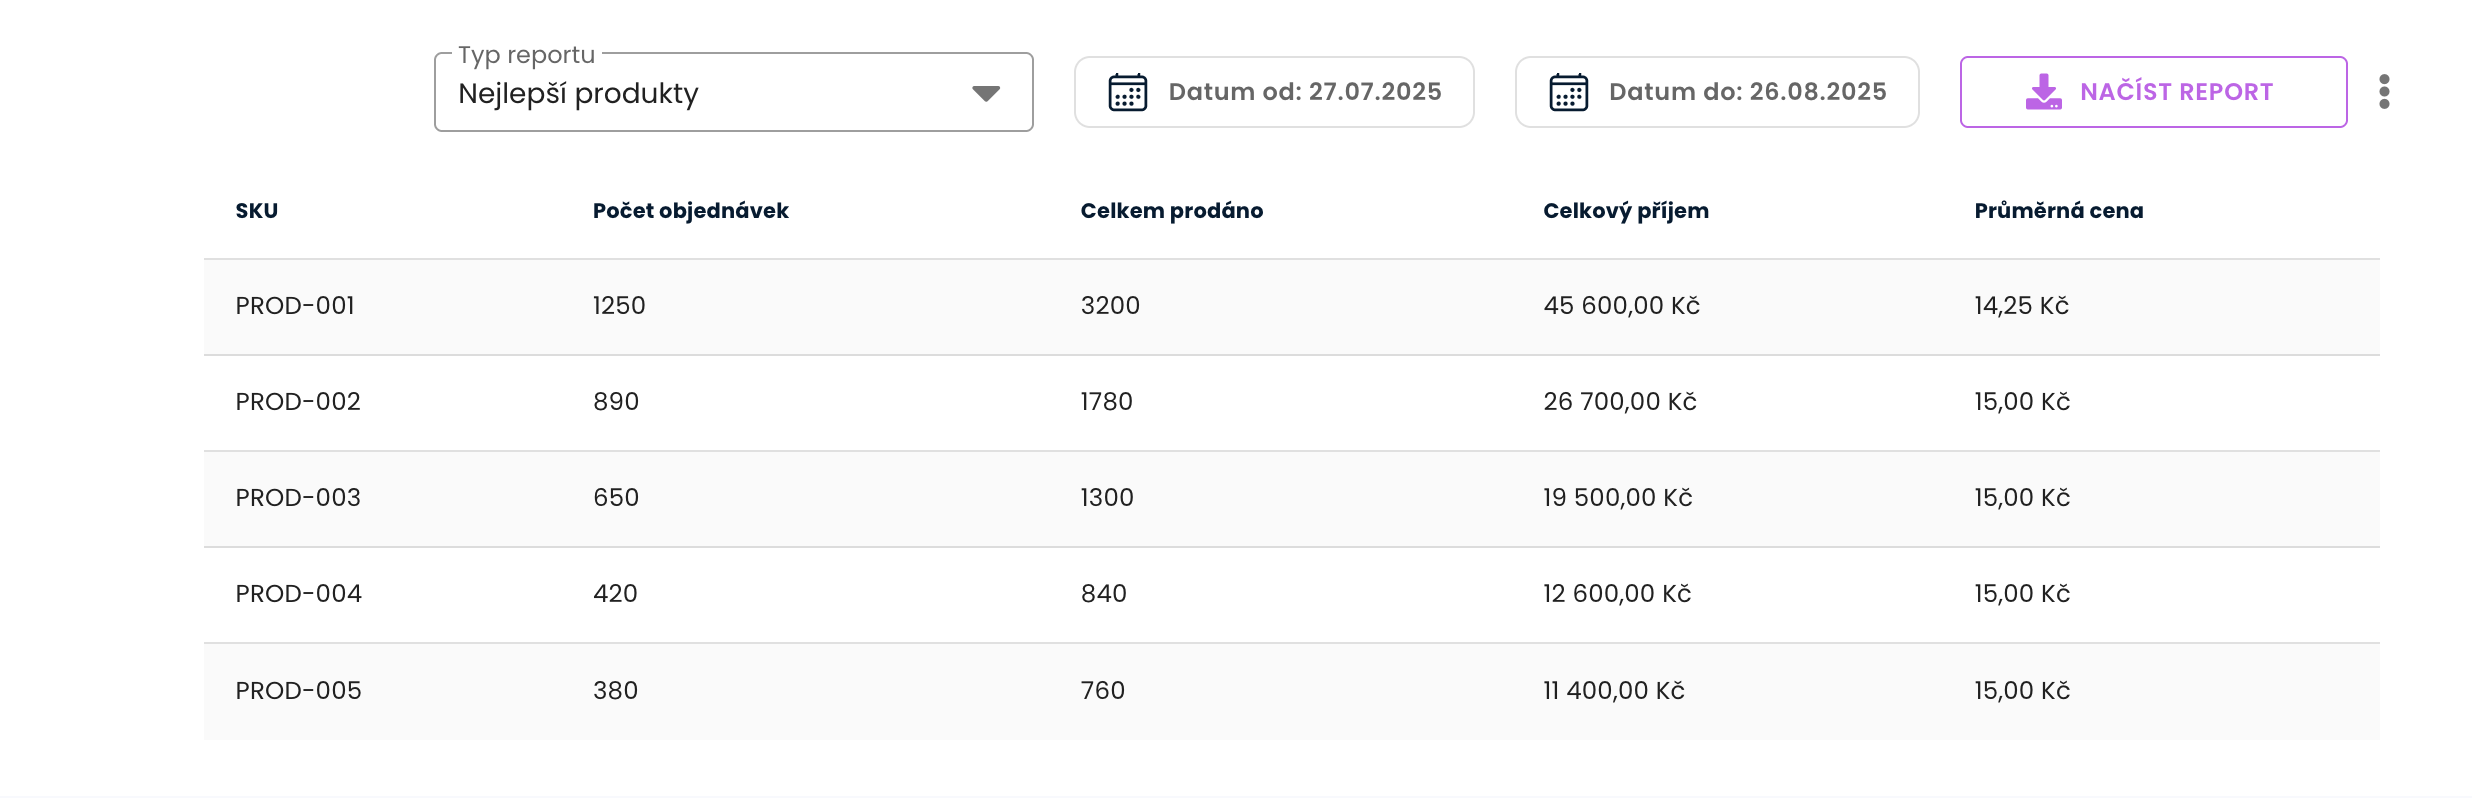
Product analysis
What it is
It identifies products that pull sales and combinations that are bought together.
How to read it (example)
Best selling products
- PROD-001: 1 250 orders, 3 200 pcs, 45 600 CZK
- PROD-002: 890 orders, 1 780 pcs, 26 700 CZK
- PROD-003: 650 orders, 1 300 pcs, 19 500 CZK
The most common combinations
- PROD-001 + PROD-002: 320
- PROD-001 + PROD-003: 280
- PROD-002 + PROD-003: 190
Action steps
- Bundles of the most common combinations (PROD-001+002, 001+003).
- Add to cart for PROD-001 (recommendation in checkout).
- Stocks: keep a higher stock at the pullers (PROD-001).
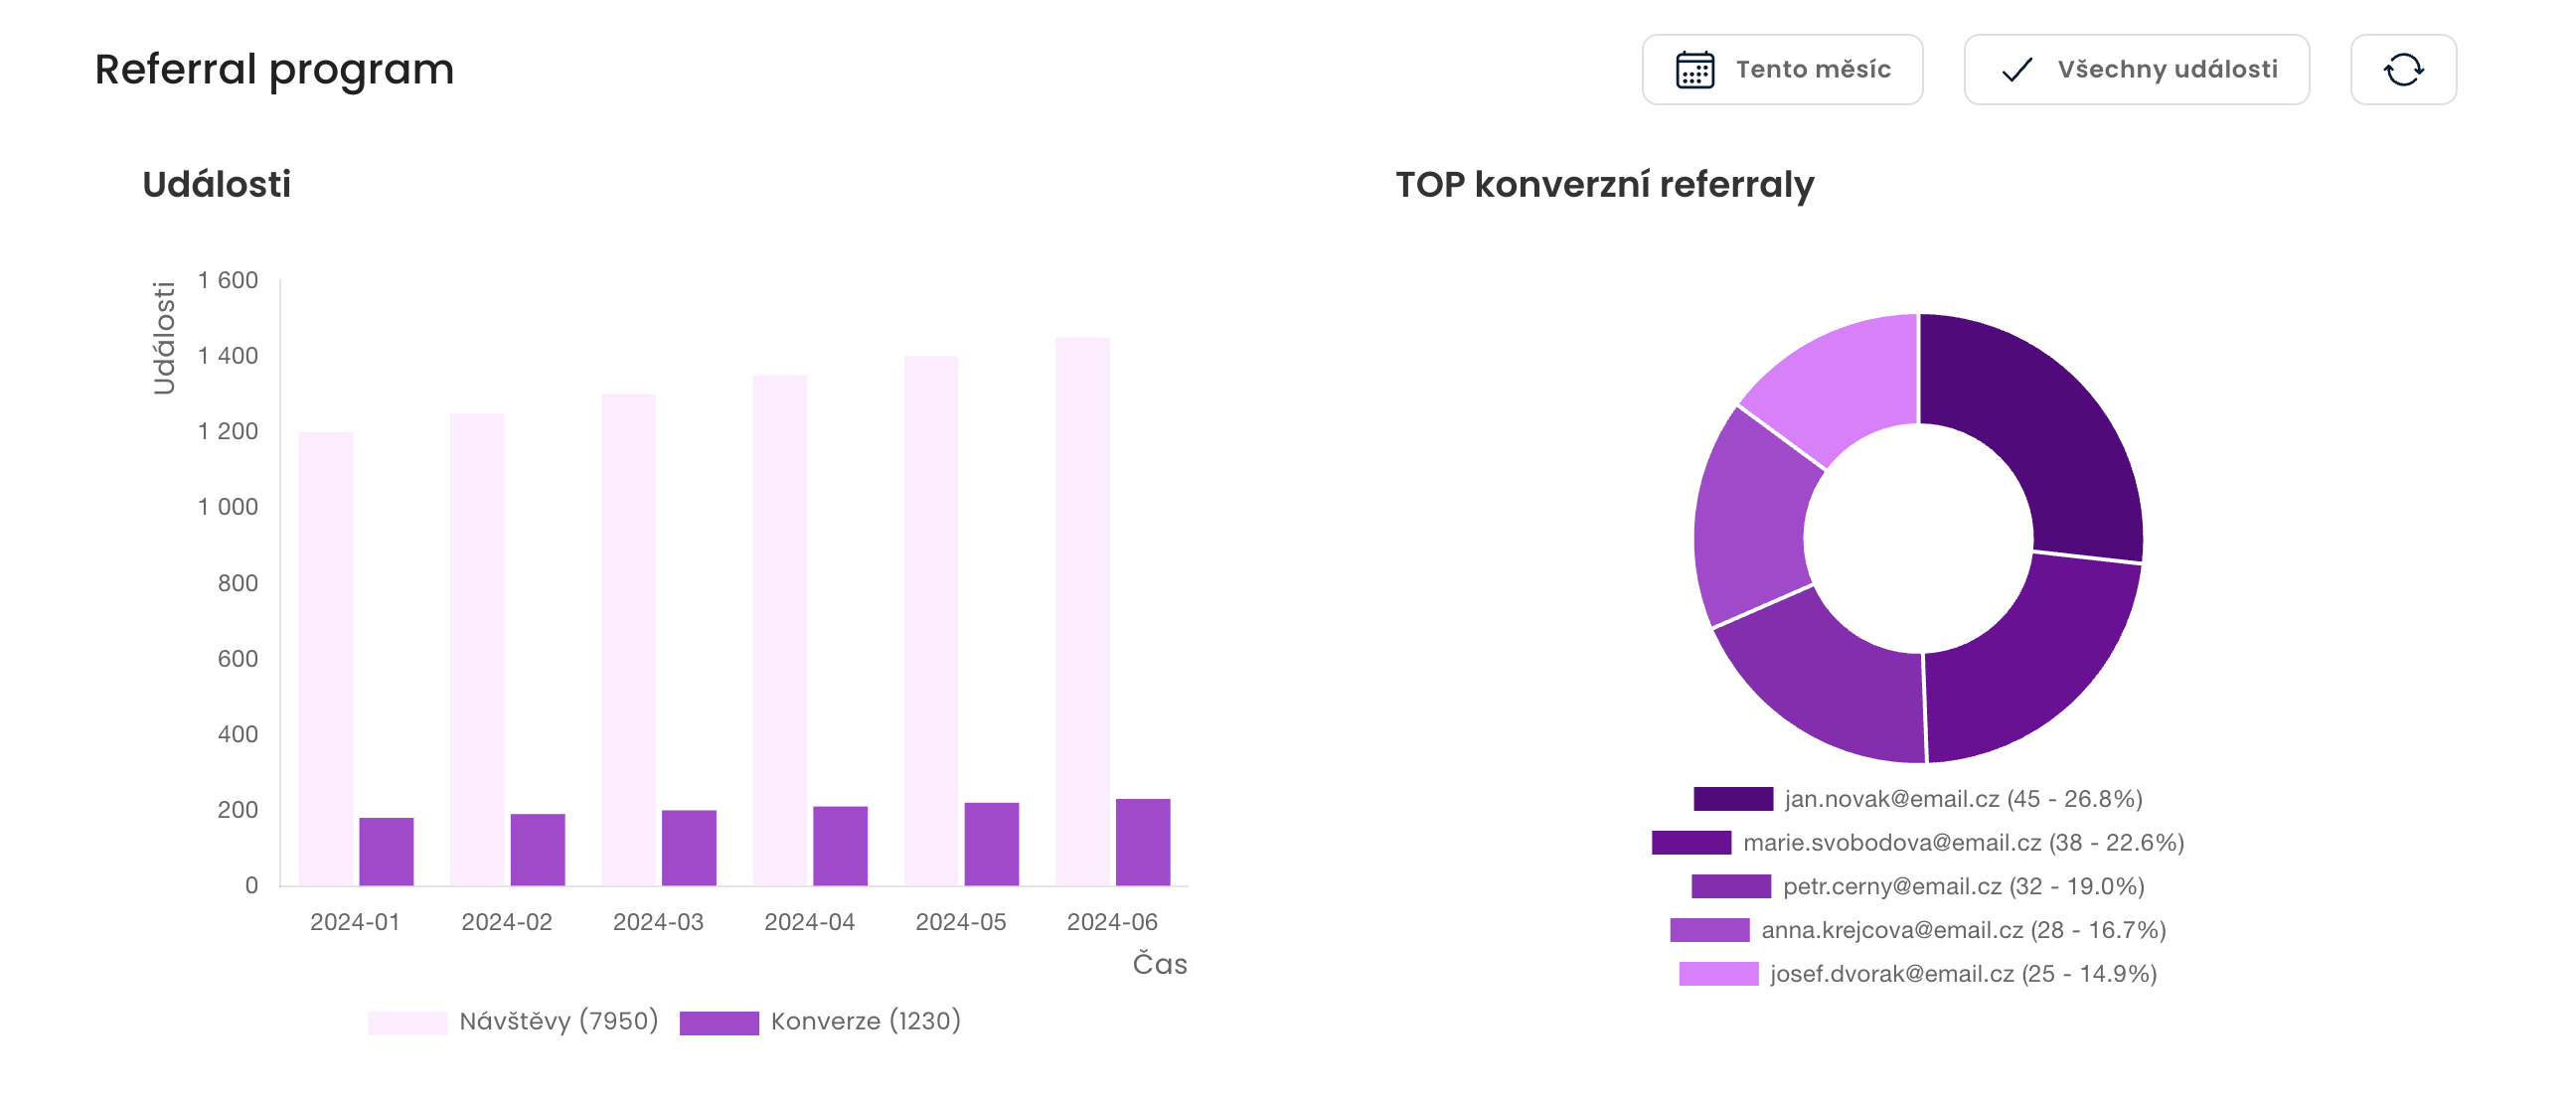
Referral program
What it is
It measures referral performance - how many visits and conversions referrers have brought.
How to read it (example)
- Visits: 7950
- Conversion: 1230
- Top referees Jan Novák (45), Marie Svobodová (38), Petr Černý (32)
Action steps
- Rewards for top players (e.g. extra points) and gamification (leaderboards).
- Creatives with a clear challenge (amount of reward, ease of sharing).
- Reminder to those who have a sharing history but have been inactive for the last month.
VIP programme
What it is
Customer distribution by VIP levels.
How to read it (example)
- Number of customers in each VIP level. Other customer groups are not visible.
Action steps
- VIP: exclusive conditions, dedicated care.
The most common positive signals in the charts (and what to do with them)
- Champions/Loyal is growing, Need to reactivate is decreasing → strengthen the program (early-access, bundly), consider a slight increase in the reward threshold.
- Grow AOV and active customers → scale what works (campaigns, bundled products).
- 20% of orders with credit → write the points advantage into your brand communication.
- Referral conversions are up → promote top referrers, test pay vs. CPA.
- Points drops are increasing → add expiration notifications, lower the min threshold for claiming.
Exports and other work with data
- Each report has a Detailed Report (CSV) for further analysis in Excel/BI.
- Reports include segment, score and metrics at the level of each customer - ideal for campaign targeting.
